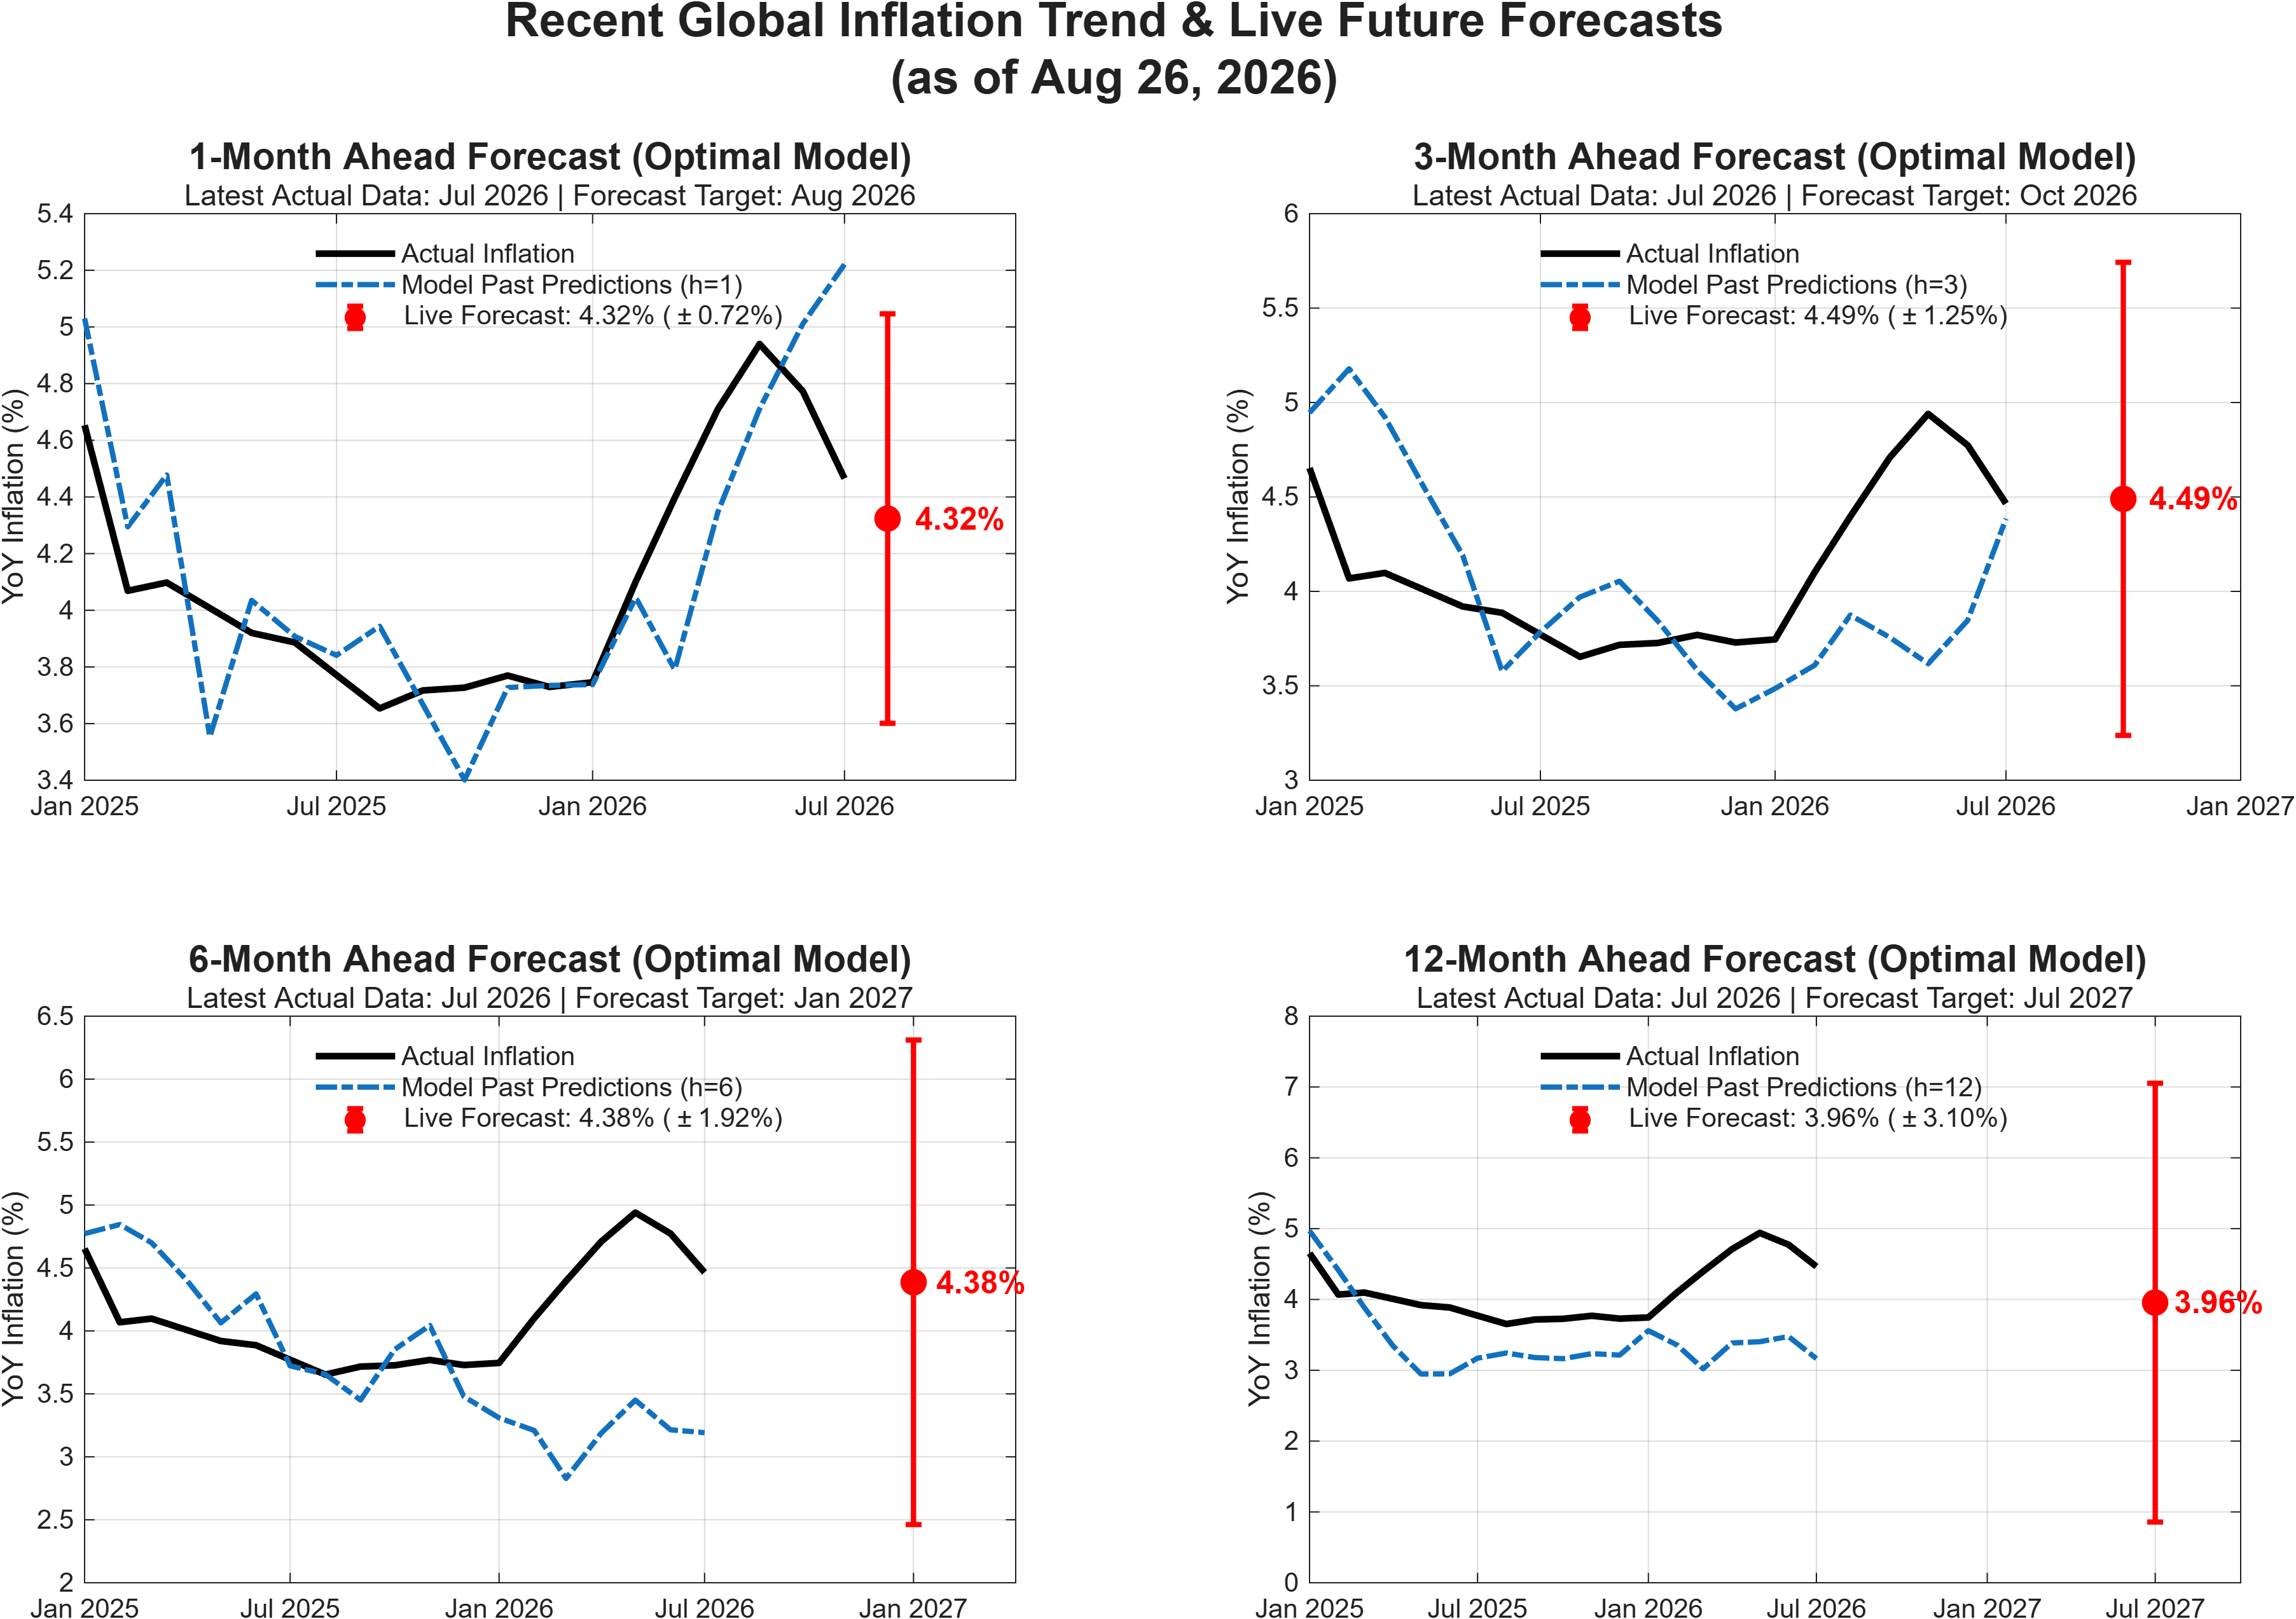
Figure 1: Recent
Global Inflation Trend and Live Future Forecasts.
This figure presents the recent historical trend and live point
forecasts for global year-over-year inflation across four distinct
horizons (1, 3, 6, and 12 months ahead). The solid black line denotes
the actual realized inflation rate. The dashed colored lines represent
the historical predictions generated by the horizon-specific optimal
machine learning models. The red markers indicate the live point
forecasts utilizing the most recently published macroeconomic data,
bounded by 95 percent confidence intervals derived from historical
out-of-sample root mean squared errors. Confidence intervals
structurally widen over longer forecast horizons, reflecting increased
macroeconomic uncertainty.
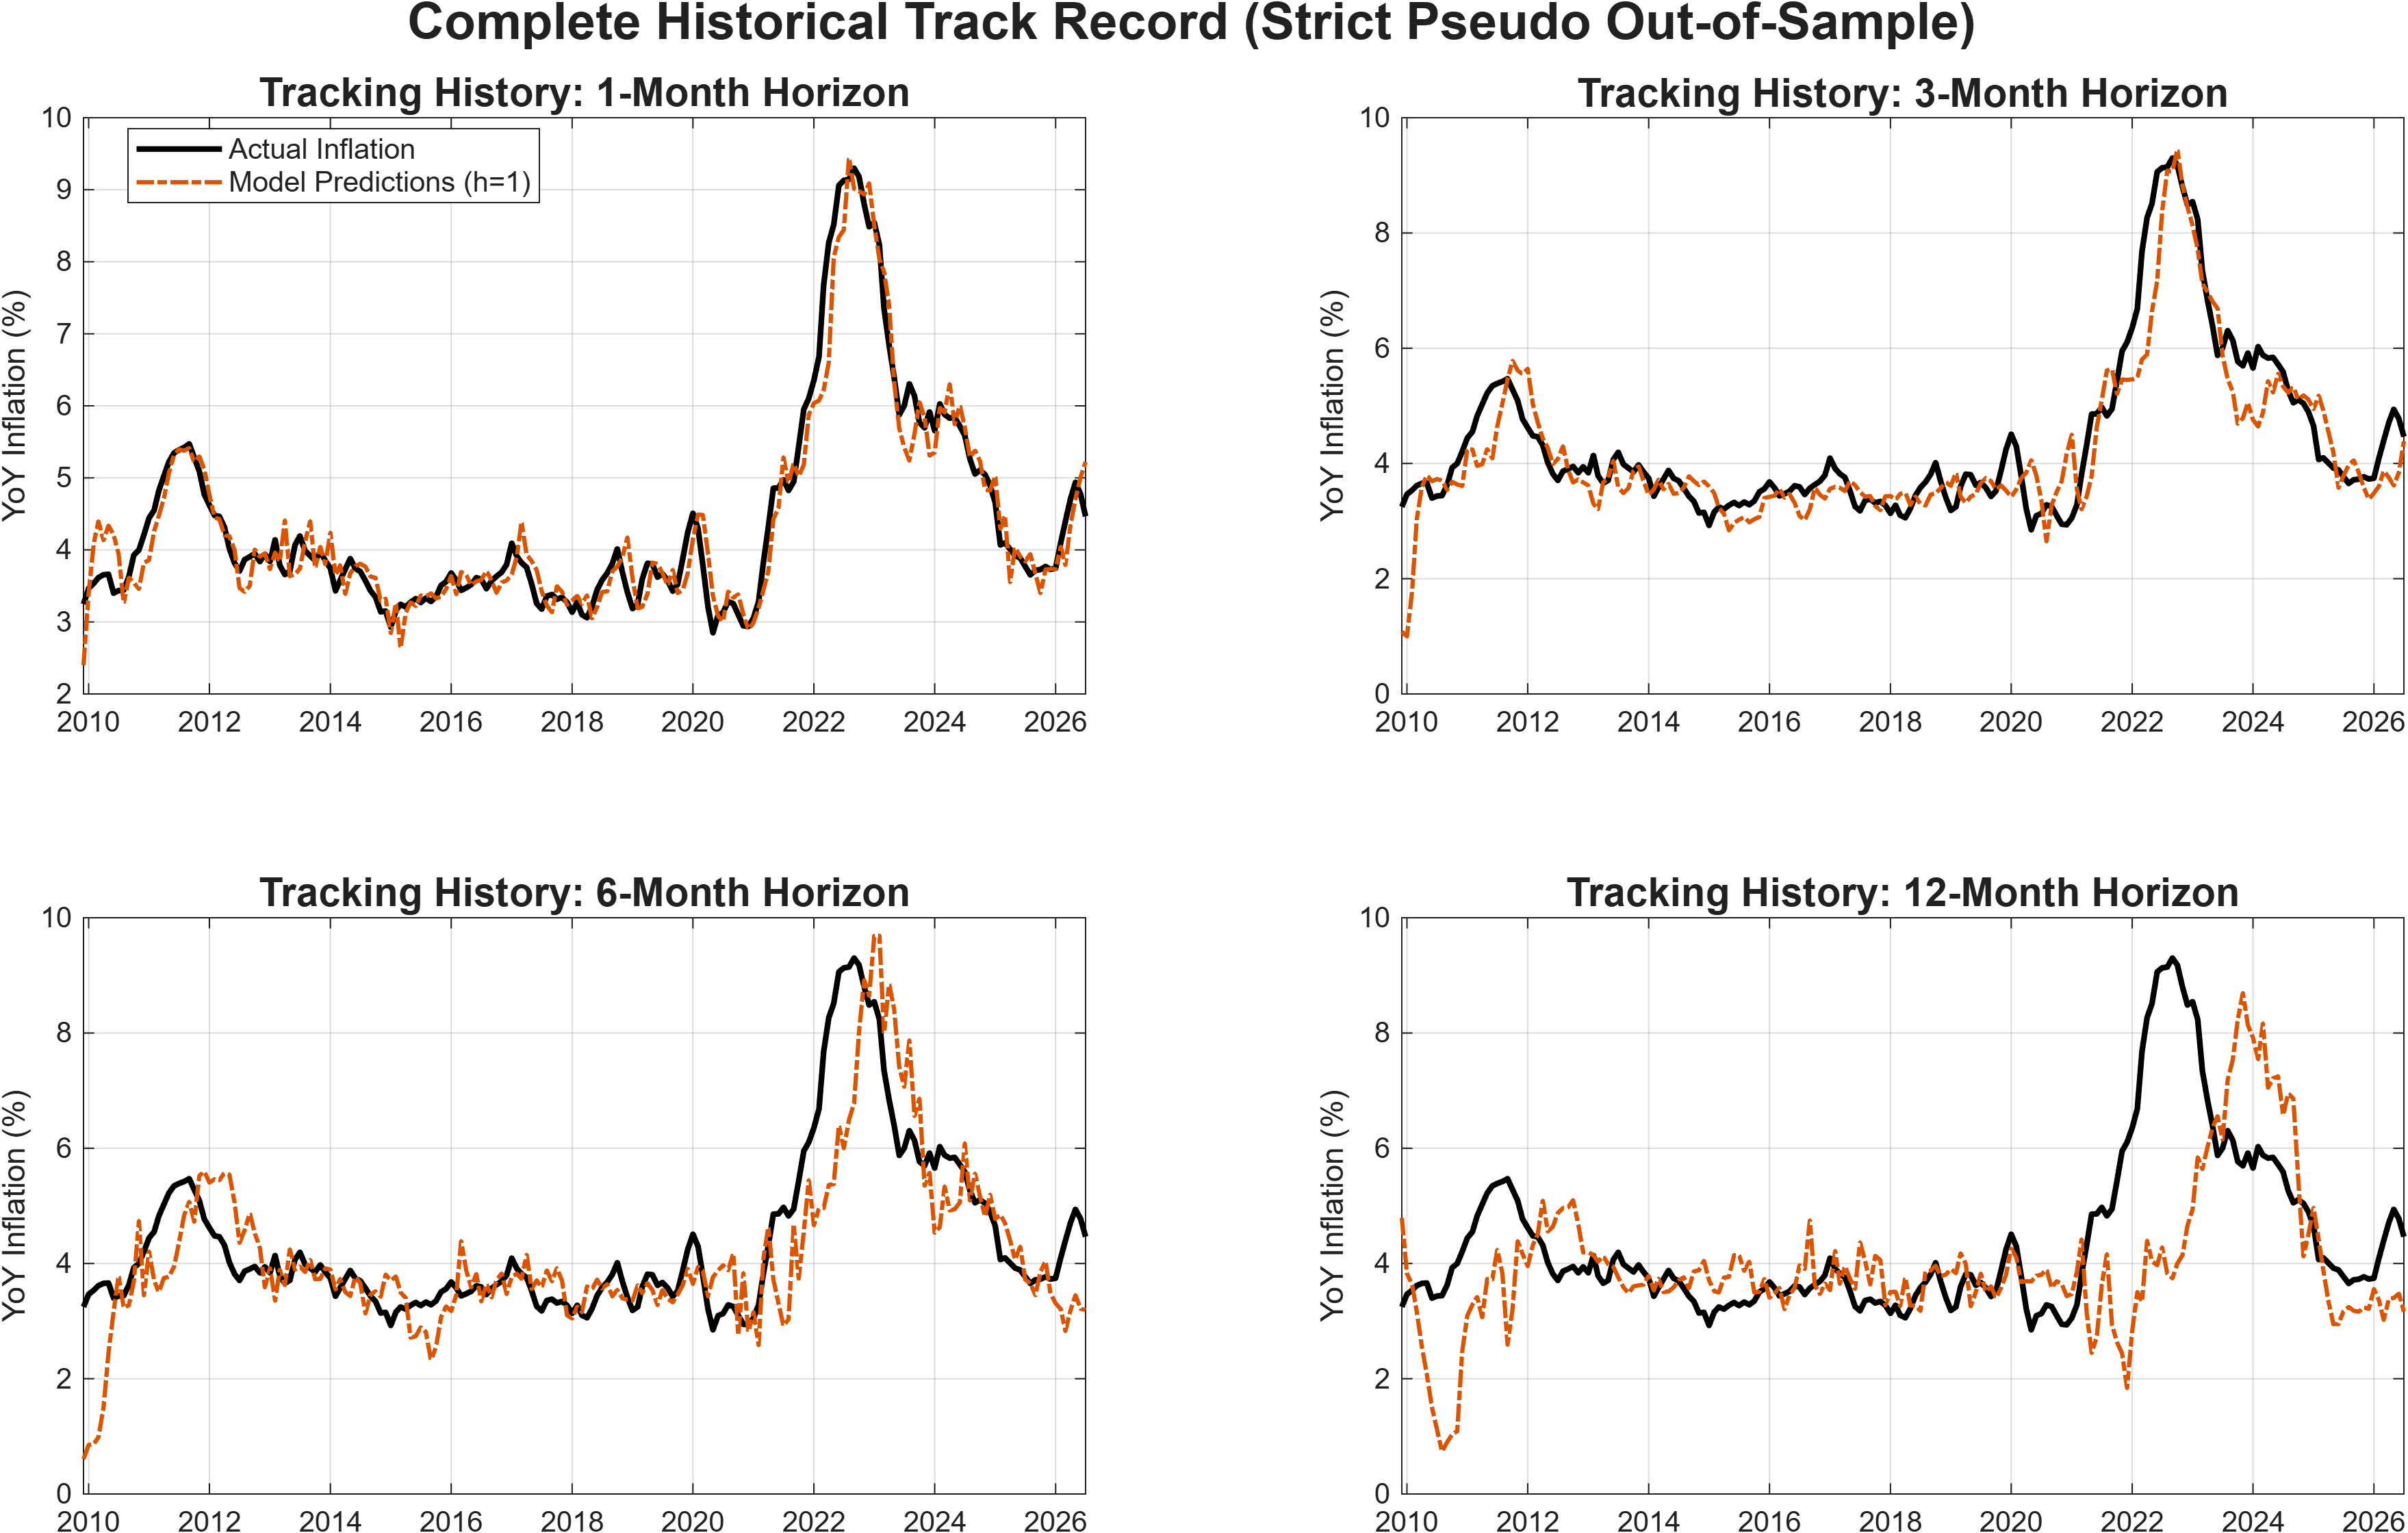
Figure 2: Complete
Historical Track Record.
This figure plots the long-term pseudo out-of-sample tracking
performance of the optimal forecasting models against actual global
inflation. The model predictions are estimated recursively over an
expanding historical window. This estimation strategy ensures that each
point forecast is generated utilizing exclusively the information
available to policymakers at that specific origin in time.
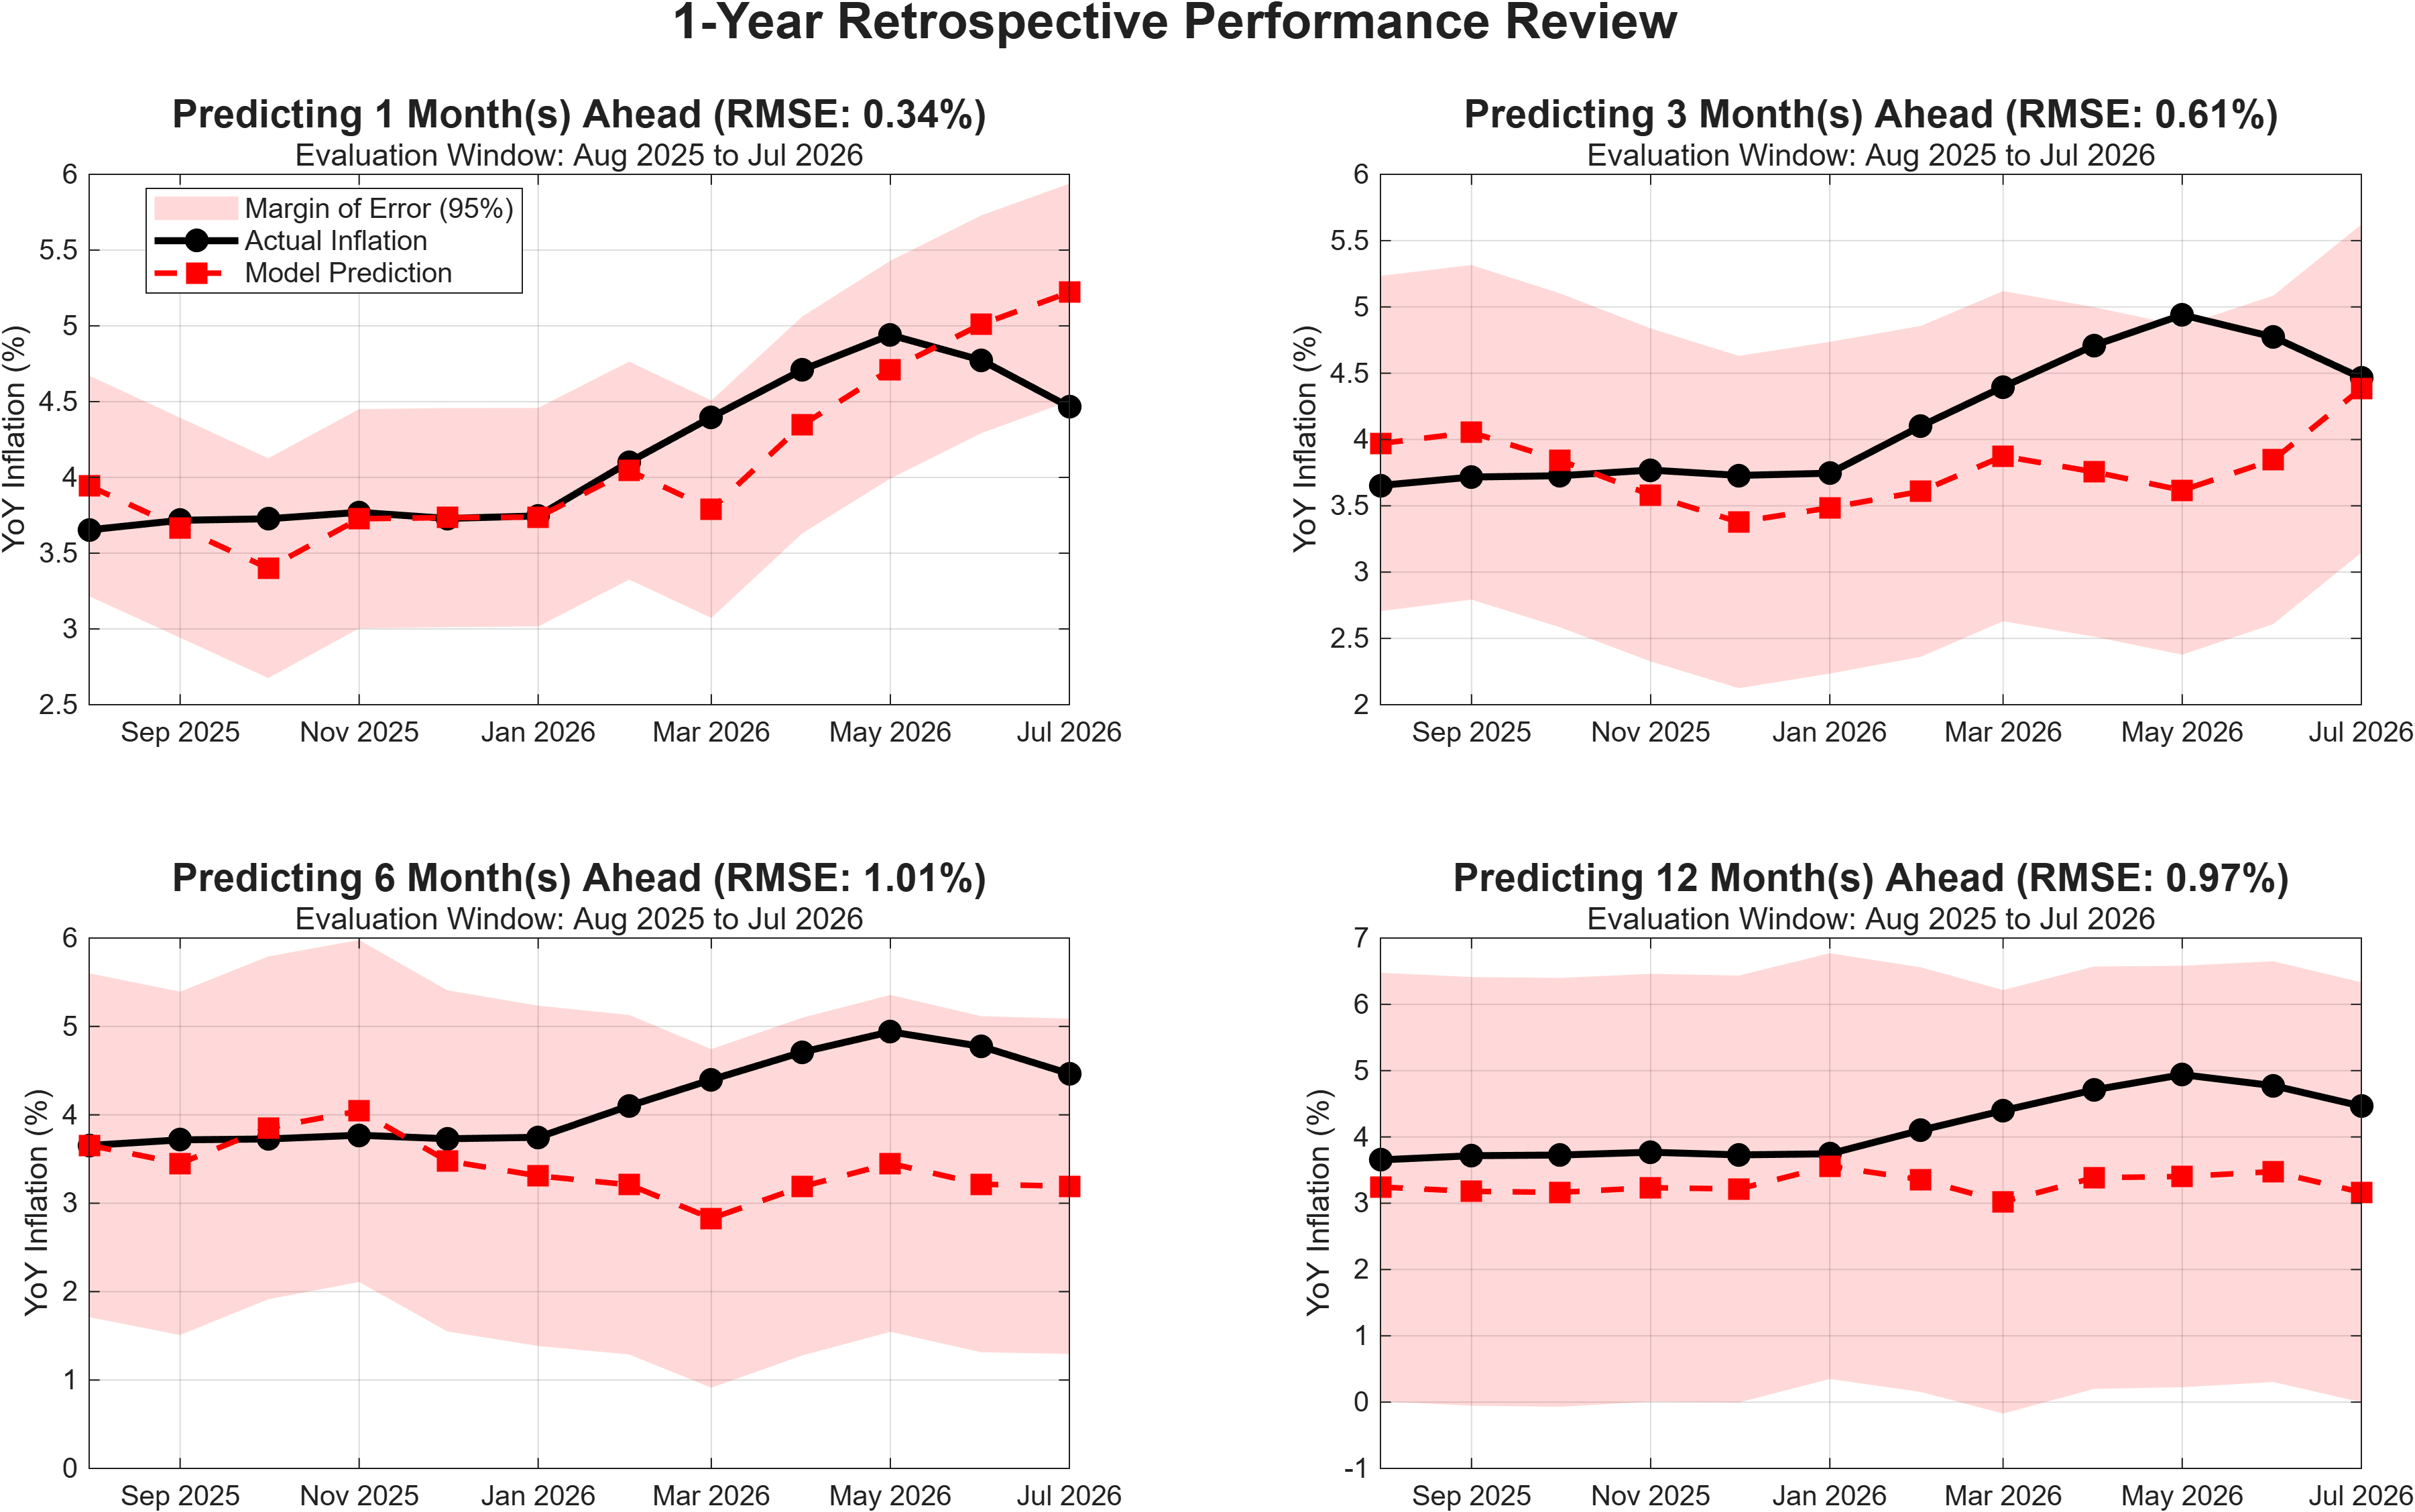
Figure 3: 1-Year
Retrospective Performance Review.
This figure evaluates the out-of-sample forecasting accuracy over the
most recent twelve-month period for each respective horizon. The red
squares represent the pseudo real-time point forecasts, while
the shaded regions denote the 95 percent confidence intervals. The
horizon-specific root mean squared error (RMSE) provides a quantitative
measure of recent predictive accuracy across shifting economic regimes.
Methodology
Overview
All technical details can be found in the corresponding
working paper.
Global inflation is constructed as a globally
synchronized target
utilizing Consumer Price Index data across 184 active countries. The
national indices are aggregated into a single representative
measure using purchasing power parity adjusted Gross Domestic Product
(GDP)
weights extracted from the World Bank. The primary target variable is
modeled as the year-over-year global inflation rate.
The predictor dataset incorporates a high-dimensional
feature space
consisting of 103 distinct macroeconomic and financial indicators
extracted primarily from the ArchivaL Federal Reserve Economic Data
(ALFRED) database. To prevent look-ahead bias associated with
macroeconomic data revisions, the framework utilizes initial release
vintages. This ensures that the forecasting algorithms process only the
unrevised historical values available to policymakers at each specific
forecast origin. This space captures global commodity prices, labor
market dynamics, production statistics, credit spreads, exchange rates,
and the Global Supply Chain Pressure Index. To enforce
stationarity, the framework applies month-over-month growth rates for
price indices and first-differences for interest rates and spreads.
Data outliers are managed via a dynamic winsorization procedure
restricted entirely to the historical training window.
The forecasting employs horizon-specific
optimal machine
learning specifications based on detailed empirical evaluation.
Specifically, the 1-month-ahead forecasts rely on a linear Support
Vector Regression paired with a hierarchical Dynamic Factor Model
feature space, zero predictor lags, and twelve target lags. The
3-month-ahead forecasts
utilize a Gaussian Process Regression applied to 15 principal
components, incorporating six predictor lags and three target lags. For
the 6-month horizon, the framework applies a Gated Recurrent Unit
neural network utilizing hierarchical Dynamic Factor Model features,
three predictor lags, and twelve target lags. Finally, the
12-month-ahead forecasts are generated using a Gaussian Process
Regression on 15 principal components with three predictor lags and
twelve target lags. To absolutely prevent information leakage, all
algorithms are estimated recursively over an expanding historical
window, enforcing a one-month publication lag to mirror
real-time macroeconomic data availability.