Current crustal movements along the Dead Sea Fault (DSF)
The DSF is a transform plate boundary separating the Arabian plate from the Sinai sub-plate. It transforms the Arabia-Africa divergent motion in the Red Sea into the convergence motion between Eurasia and Arabia, currently expressed by extrusion of Anatolia (insert - Figure 1). However, not all the African-Arabian divergent motion is transferred northward to the convergence zones. Some of the divergent motion in the Red Sea propagates into the Gulf of Suez, which forms the southwestern boundary between Africa and Sinai. North of the Gulf, the Africa-Sinai boundary is diffuse and hard to allocate. Additional divergent motion is taken up by secondary faults branching off the main trace of the DSF north of the Dead Sea (Figure 1). The activity along the DSF has been continuous since the Miocene to the present. The total displacement across the southern section of the DSF (south of 32°N) was estimated as 105 km, whereas across the northern section the estimated displacement is significantly less.
The DSF is subjected to a moderate level of seismicity (Figure 1b). The highest recorded seismic activity was in the Gulf of Elat (Aqaba), the location of the 1995 Nuweiba earthquake. Another area of concentrated activity is the area of the Dead Sea, where the M=6.5, 1927 Jericho earthquake occurred. Seismic activity along the Arava Valley, which is located between the Gulf of Elat (Aqaba) and the Dead Sea, is very limited. North of the Dead Sea, seismic activity is distributed over a wide area, reflecting diffuse deformation in northern Israel and Lebanon.
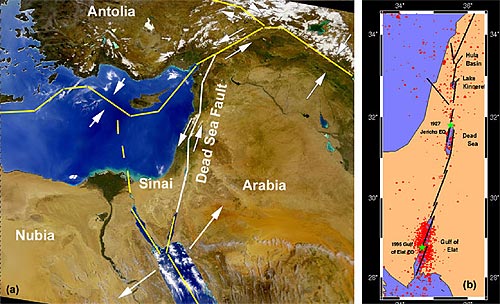
Figure 1. Location map of the Southern Levant showing (a) the overall geography of the region, main tectonic elements, and (b) earthquake epicenters [GII Bulletin, 1996; online update at http://www.gii.co.il/html/seis/seis_fs.html].
Horizontal movements along the DSF — GPS studies
A network of 11 continuous GPS stations was constructed in Israel between 1996 and 2001 to monitor current crustal movements across the Dead Sea Fault (DSF). Analysis of the GPS measurements with respect to the ITRF2000 Reference Frame yields time series of daily site positions containing both secular and seasonal variations. Horizontal secular variations (station velocities) are evaluated with respect to the main tectonic element in the region, the DSF. We use six velocity vectors west of the DSF to define the ITRF2000 pole of the Sinai sub-plate, and rotate the velocity field for all stations into the Sinai reference frame (SRF). The velocity vectors reveal: (1) Relative station movements are less than 4 mm/yr; (2) The nine stations located west of the DSF show no statistically significant motion with respect to the SRF; (3) The two stations located in the Golan Heights (KATZ and ELRO) and a station in Damascus, Syria (UDMC) show 1.7-2.8 mm/yr northward motion with respect to Sinai, indicating a left-lateral motion along the DSF. Using locked-fault models we estimate the current slip rate across the DSF as 3.3–0.4 mm/yr. If we exclude the northern sites (ELRO and UDMC), which are located adjacent to the compressional jog of Mt. Hermon, our estimate increases to 3.7–0.4 mm/yr. The calculated ITRF2000 Sinai, Eurasia and Nubia poles and a published pole for Arabia allow us to calculate the current relative plate motion of Sinai-Arabia and Sinai-Nubia.
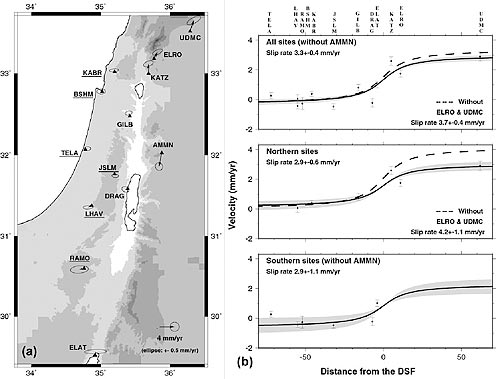
Figure 2. (a) Velocity map of continuous GPS stations with respect to Sinai Reference Frame. Ellipses represent 95% uncertainties. (b) Observed and modeled fault-parallel (VN) velocity component drawn as function of distance from the DSF for all, northern, and southern sites. The modeled velocities are calculated using elastic locked-fault models with 12-km-thick seismogenic layer (D). The shaded areas mark the 1-s uncertainties of the best fit solutions.
More details at Wdowinski et al. (2004) and Pe'eri et al (2002).
Vertical movements along the Dead Sea Shores — InSAR studies
The Dead Sea (Fig. 1) is the lowest place on the continental surface of the Earth (414 m below mean sea level). It is located within one of the pull-apart basins that formed along the Dead Sea fault system. The uplifted margins of the basin are built of Precambrian basement rocks overlain by Paleozoic to Cenozoic sedimentary and igneous rocks. Miocene to Holocene, mostly lacustrine and terrestrial sediments have accumulated within the basin. The upper few tens of meters along the Dead Sea shores consist of the late Pleistocene Lisan Formation composed of alternations of crystalline aragonite and detrital material, overlain by the Holocene coarse and finegrained detrital layers of the Ze'elim Formation.
A thick (.2000 m) sequence of mostly marine salt with interbedded gypsum, shale, and dolomite rocks of Pliocene to Pleistocene age has built several salt diapirs in the Dead Sea area. In Mount Sedom (Fig. 3c), the diapir is exposed at the surface. Other diapirs (e.g., Lisan Peninsula) remain buried at varying depths (in places only ;100 m) below the surface.
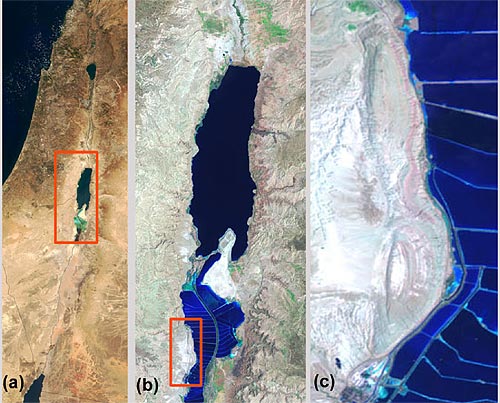
Figure 3: Satellite images of Israel (a) the Dead Sea Basin (b) and Mount Sedom (c).
The Dead Sea basin has been subjected to vertical movements due to the salt tectonics and rapid changes in watershed hydrology, which is reflected in ~1 m per year decrease of the Dead Sea level. By using space-based InSAR technology, we were able to detect both uplift movement of Mt. Sedom diapir (Figure 4) and subsidence due to aquifer-system consolidation in response to the decreasing Dead Sea level and the groundwater table along the shores (Figure 5).
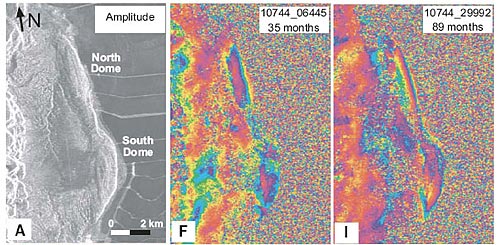
Figure 4: Mount Sedom interferograms (showing uplift) for periods of 35—89 months. Note the difference in number of interference rings between the northern and southern parts of Mount Sedom and the increasing uplift with time.
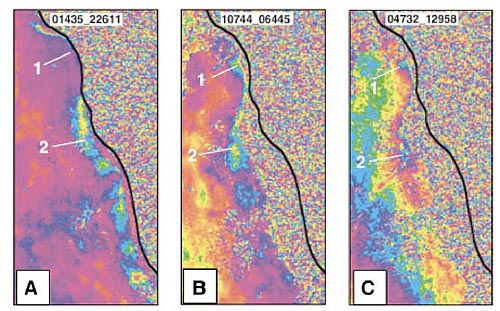
Figure 5: Change interferograms for three areas along the western shore of the Dead Sea. Solid lines represent the 1995 coastline; the pattern of fine colored pixels is water. Interferograms A—C show the area south of Wadi Hever (frame 2979, descending track) for periods of 3, 35, and 64 months, respectively. Hever delta and Hever sinkhole site are marked 1 and 2, respectively. Width of image represents 3.5 km.
More details at Baer et al. (2002) and Weinbergeret al. (2006).