Hydrogeodesy
Hydrogeodesy is an applied scientific field that uses accurate geodetic observations to measure or infer hydrological quantities and their changes over time (processes, fluxes). Hydrogeodsy supports hydrological monitoring, management, and research by providing observations or inferred quantities that cannot be obtained by standard hydrological observations. While most hydrological observations are point measurements of direct hydrological quantities, as water level or soil moisture level, hydrogeodetic observations are obtained indirectly from geodetic data, which are translated to hydrological quantities, as terrestrial water storage (TWS), surface water level changes, or aquifer storability. The main advantages of hydrogeodetic observations and infer quantities are in their spatial coverage. Unlike the hydrological point measurements, hydrogeodetic observations are obtained with high spatial resolution. Some examples are: (1) Interferometric Synthetic Aperture Radar (InSAR) observations have a spatial resolution of 1-100 meters, depending on acquisition parameters; (2) GPS-IR (interferometric reflectometry) integrate observations of soil moisture and snow depth over an area of roughly 100 m2; and (3) GPS- and GRACE-inferred TWS estimates, are obtained for broad areas in the order of tens to hundreds kilometers. The dimension of an observed area varies depending on the measurement technique from tens of meters, in the case of GPS-IR, to hundreds of km in GRACE measurements.
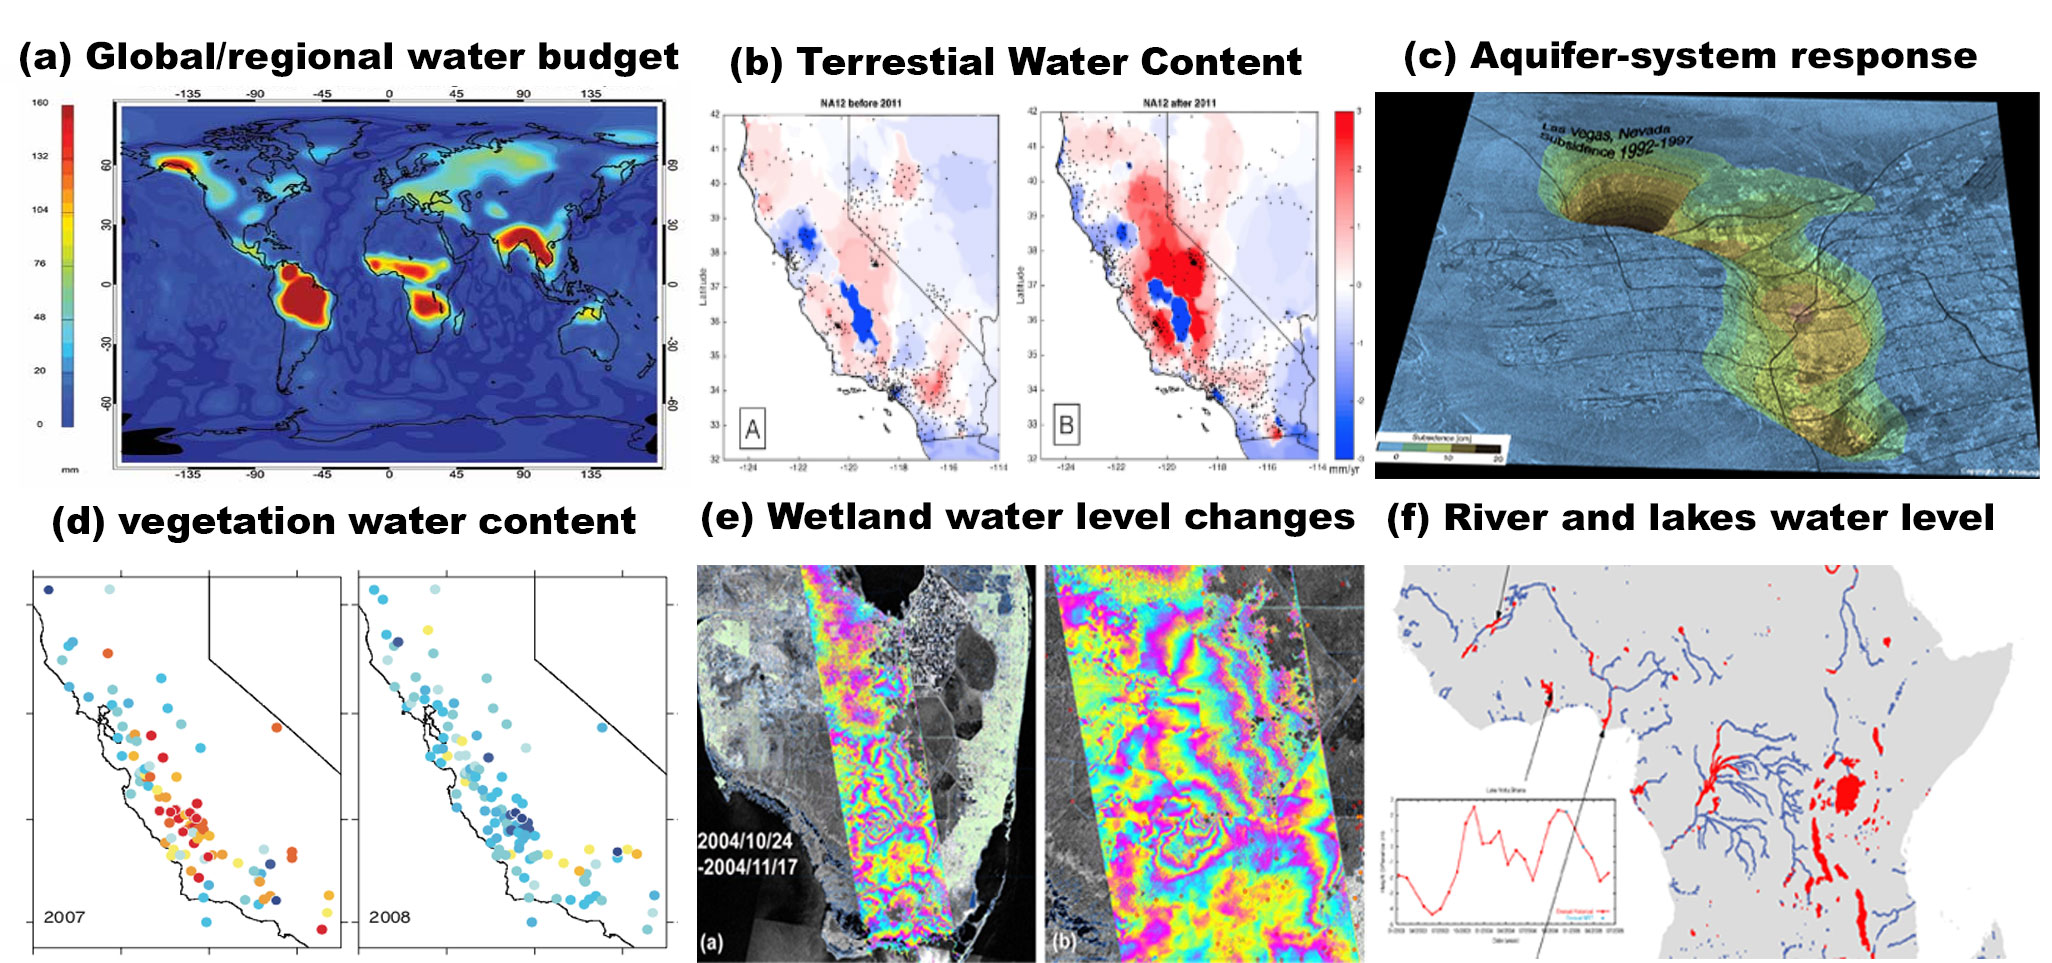
Figure 1. Space geodetic hydrogeodesy applications: (a) Global/Regional water budget – GRACE (NASA); (b) Terrestial water content – Hammond et al. (2016); (c) Aquifer system deformation – Amelung et al (1999); (d) Peak vegetation water content – Larson (2016); (e) Wetland water level changes – Wdowinski et al. (2006); (f) Rivers and Lakes water level – ESA - http://esamultimedia.esa.int/images/EarthObservation/River-lake-mask-n-data-africa_H.jpg
My contribution to hydrogeodesy is developing the Wetland InSAR application, which is a unique application of InSAR technique. Wetland InSAR provides high spatial resolution observations of surface water level changes in aquatic environments with emergent vegetation, such as wetlands and floodplains. The technique works because of the “double-bounce” effect, in which the radar pulse is backscattered twice, first from the water surface and then from the vegetation, or vice versa, first from the vegetation and then from the water surface. Interferometric coherence analysis of various SAR data types indicates that longer wavelength (L-band), short revisit cycles, HH polarization, high spatial resolution, and small incidence angle are more suitable to wetland InSAR application in terms of decorrelation. Best results have been obtained with the L-band (ALOS and JERS-1) data, X-band (TSX) data with 11-day repeat orbits, C-band RSAT-1/2, and Sentinel-1 data with 24 and 12 days repeat orbits, respectively. The application of the wetland InSAR technique to various wetland environments around the world shows that in many wetland areas, interferometric coherence can be maintained and, furthermore, the wetland InSAR observations can provide high spatial resolution observations that cannot be obtained by any terrestial technique. In addition to high spatial resolution water level monitoring, wetland InSAR applications include detecting flow patterns and flow discontinuities and constraining high-resolution flow models. The development of the wetland InSAR time series techniques (Hong and Wdowinski, 2013; Hong et al., 2010b) provides improved high-spatial, multi-temporal water level observations that can be helpful for water management and hydrological modeling. More information on the methodology and technique is available in the section Wetland InSAR.
Figure 2. A representative Sentinel-1 Interferogram (20161009-20161021) showing phase change over south Florida. (a) Most phase changes reflect surface water level change, but also tropospheric phase delay. The white solid lines mark the boundaries of the hydrologic units (WCA1, WCA2A, WCA2B, WCA3A, WCA3B, BCNP, ENP). Interesting hydrological signals are marked by red dash boxes are enlarged in figures (a1), (a2), and (a3). Each fringe cycle (from red to yellow to green to blue and back to red) in the interferogram represents a 3.6 cm vertical elevation change. All interferograms presented in the following share the same color scale as presented here. [Source: Liao et al. (2020)]
Wetland InSAR publications: Wdowinski et al. (2004); Wdowinski et al. (2008); Gonwe et al. (2010); Hong et al. (2010a); Hong et al. (2010b); Hong and Wdowinski (2011); Kim et al. (2013); Wdowinski et al. (2013); Hong and Wdowinski (2014a); Hong and Wdowinski (2014b); Brisco et al. (2015a); Brisco et al. (2015b); Oliver-Cabrera and Wdowinski (2016); Wdowinski and Hong (2017); Hong and Wdowinski (2017); Jaramillo et al. (2018); Liao et al. (2020)