Spatial analysis of current crustal movements in Southern California
Geodetic measurements of crustal movements in California provide critical observations for understanding earthquakes. Almost a century ago, Read (1910) analyzed geodetic measurements acquired before and after the 1906 San Francisco Earthquake to establish his “elastic rebound” theory. Based on additional geodetic measurements and theoretical considerations, the elastic rebound theory expanded into a four stage conceptual model, known as the “the earthquake deformation cycle”. The model includes the following stages: co-seismic (fault rapture during large earthquakes, M>6), inter-seismic (time independent deformation occurring between large earthquakes), pre- and post-seismic occurring short time before and after the large earthquake, respectively. So far, geodetic observations only detected inter-seismic, co-seismic and post-seismic deformation. Unfortunately, no measurements show a clear pre-seismic signal, which could serve as a precursor to an earthquake.
Over the past three decades, space-based technologies (VLBI, SLR, GPS, and InSAR) have revolutionized the field of geophysical-geodesy by providing a large number of very precise crustal movement observations. Many such observations collected in Southern California were compiled by the Southern California Earthquake Center (SCEC) working group, which produced consistent dataset of current crustal movements, known also as SCEC v2.0 and v3.0 velocity fields. These datasets describe the inter-seismic velocities across most major fault system in Southern California. In the two studies below, we conducted spatial analyses of the two SCEC velocity fields to (i) detect active faults independent of seismic and/or geological observations, and (ii) characterize the diffuse inter-seismic deformation across the Pacific-North America plate boundary. Both studies show that dense geodetic networks are essential for detecting the details of crustal movements and understanding the complexity of the earthquake deformation cycle.
Geodetic detection of active faults
Over the past 30 years the largest magnitude and most destructive earthquakes in southern California (e.g., the 1971 San Fernando, the 1992 Landers, the 1994 Northridge, and 1999 Hector Mine earthquakes) occurred along faults that were not detected either seismically or geologically prior to the earthquakes. Because preliminary knowledge of the location of active faults and proper preparation by the authorities can help mitigate earthquake damage, it is important to be able to detect active faults by other techniques beside seismic and geologic methods.
Here we present a new method which uses geodetic observations to detect active faults. Our method relies on the observed phenomenon that during the interseismic stage of the earthquake deformation cycle, elastic strain accumulation localizes along active faults (Figure 1). Although this phenomenon has been known for almost a century, it has not been adequately exploited for the detection of active faults. We applied our method to the Southern California Earthquake Center (SCEC) velocity field for southern California version 2.0.
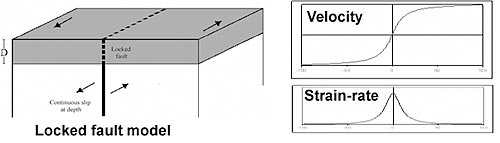
Figure 1: (left) Schematic illustration of a locked-fault (dislocation) model. (right) The expected velocity and strain-rate profile across an active locked fault. The predicted high strain-rate along the fault can be used to detect locked faults.
The new analysis reveals that interseismic deformation is localized along a dozen sub-parallel narrow belts of high shear strain rate. The locations of the belts correlate well with active geologic fault segments and concentrated zones of microseismicity. The highest shear strain rate (0.95 m-strain/year) is observed along the creeping Parkfield segment of the San Andreas Fault (SAF). High shear strain rates (0.3-0.6 m-strain/year) are also observed northward and southward of the big bend, whereas the big bend itself is characterized by a diffuse low magnitude shear strain rate (< 0.3 m-strain/year). Four low magnitude parallel belts are observed, corresponding to secondary fault segments closer to the coast, one within the highly populated Los Angeles basin (Newport-Inglewood segment) and the others further south. Dilatational deformation is diffuse and of relatively low magnitude (< 0.2 m-strain/year), with the highest contraction rates reflecting the ongoing contraction within the Ventura and Los Angeles basins. Because no prior assumptions were made regarding the geology, tectonics, or seismicity of the region, our analysis demonstrates that geodetic observations alone can be used to detect active fault segments.
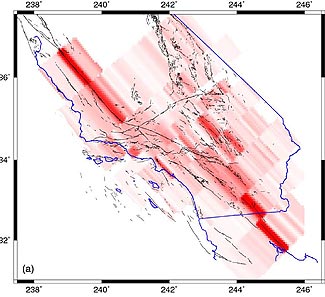 Figure 2:Maps showing the distribution and
magnitude of maximum shear strain rate and its relation to the
geographic location of major fault segments.
Figure 2:Maps showing the distribution and
magnitude of maximum shear strain rate and its relation to the
geographic location of major fault segments.
More details at Wdowinski et al. (2001).
Diffuse intersesimic deformation across the Pacific-North America plate boundary
The steady motion between the Pacific and North American (tectonic) plates deforms a wide region in western US, extending over California, Arizona, Nevada, and Utah. Most of the deformation is absorbed by the San Andreas Fault, but also by other fault systems. The deformation increases the stress level within the Earth's crust, mainly along fault segments. Once the stresses reach high enough values, which cannot be supported by the crust, faulting occurs and the excess stress is released by an earthquake. Crustal movements occurring within the wide (diffuse) deforming area are measured nowadays very precisely (mm/yr precision level) using the Global Positioning System (GPS) and other accurate techniques.
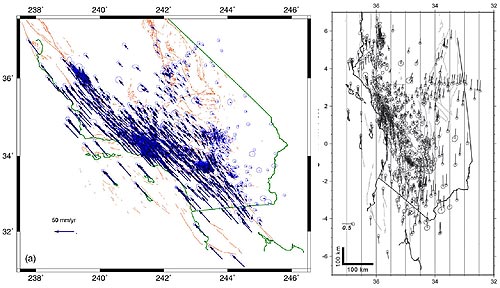
Figure 1: The SCEC 3.0 velocity field in the stable North America reference frame (left) and in the Pa-NA Pole of rotation coordinate system.
In this study, we used 840 very precise velocity vectors measured during the past 25 years, mainly in southern California, to study the nature of the interseismic deformation (steady crustal movement between large earthquakes) within the wide plate boundary deformation zone. We used a geometrical technique that allowed them to decompose observed crustal movements into parallel and normal components to the Pa-NA plate motion. The results of our analysis show that despite the very different fault systems occurring across the San Andreas Fault, half of the relative plate motion is absorbed east of the fault and half west of it. Deviation occurs in the southern section, where the half motion contour correlates with the San Jacinto and Imperial fault segments. This analysis yields interesting asymmetric patterns in both parallel and normal components. The parallel components show asymmetrical velocity gradients across the San Andreas Fault and the normal components indicates compression southwest of the Big Bend, but not northeastward. The observations are compared with viscoelastic modeling results, which show a similar velocity field. The main disagreements between the observations and the model are located in a narrow band along the SAF and in the Mojave Block, suggesting that crustal heterogeneities and additional unmodeled fault segments should be considered in future models.
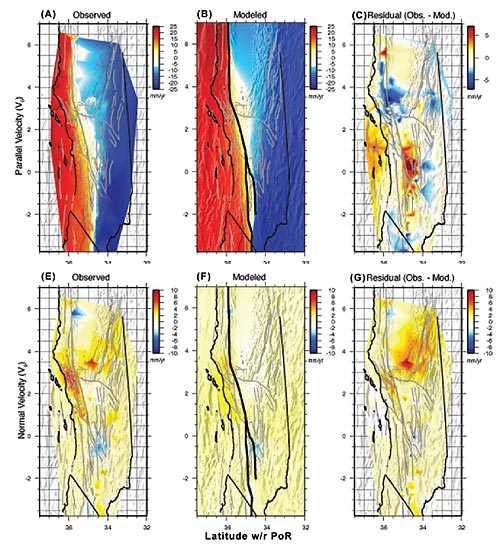
Figure 2: Parallel and normal components of the observed, modeled, and residual velocity fields. The comparison shows small parallel residuals, mainly along the trace of the SAF (c) indicating good agreement between the observed (a) and modeled (b) fields. North-oriented velocity is taken to be positive for the parallel component. Also note that a smaller scale is used in the residual map (c). The normal residual (f) indicates very minor differences between the observed (d) and modeled (e) fields. West-oriented velocity is taken to be positive for the normal component.
More details at Wdowinski et al. (2007) and the manuscript's Appendices.