 |
|
Limits
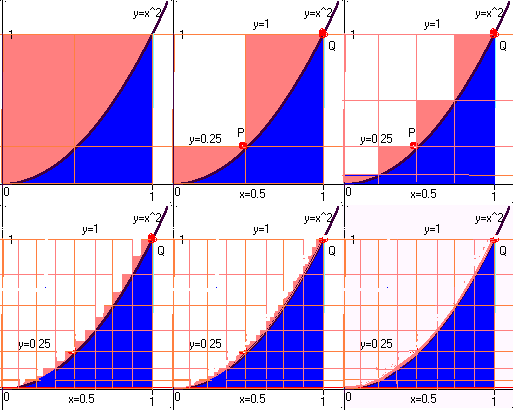
This animation [click 'refresh' or
'reload' to see it again] shows that after 7 steps the
approximation is nearly exact. The right answer (1/3)
should be the limit of our approx's. So far, we have
three approx's to look at...1, 0.625 and 0.468 ... with
no obvious pattern.
In order to take a limit, we need to
proceed more methodicly, we need a pattern, and we need
some notation.
|
Let 'n' be the number of rectangles being used. Each rectangle
has base = 1/n. The right endpoint of the base of the k-th
rectangle is called x_k (so x_1 = 1/n, x_2 = 2/n, etc - see the
picture below, where n=4). As before, we get the height of the
rectangle by plugging x_k = k/n into y=x^2 [so, height =
(k/n)^2]. So, its area is bh = k^2/(n^3). Now we use Sigma
notation (and a theorem) to add all these areas up.
If you need some comic relief right now, let n=1 and see what
you get. It should match the value of A we got using just one box
(A=1). And n=2 should match the number under Picture 2 (previous
page) which was 0.625. You don't really have to check this way,
but it's nice to know we have found the right pattern.
Finally, we can get the exact area of the blue region by
taking a limit as n (the number of rectangles) gets big.

There is a bit more to say (and I did so in
class!) but I'll just summarize it for now -
The sums we just used are called 'Riemann
Sums'.
The limit we just took is (almost by
definition) the integral of x^2 from 0 to 1.
We have some flexibility in how we choose
the widths and heights of the rectangles. This requires
more notation to explain (done in class), but it isn't
even intended to help with calculations. It just makes
the theory work (for example, the "abc thm").
Don't try this on a curve like sin(x). It
would be too hard, and there IS a shortcut coming (the
FTC).
Try to understand the C-A-L aspects of
integration. You'll need that to know how to apply the
method to other problems.
Back to Start
Back to Help Page


