

Limacons
Last modified on
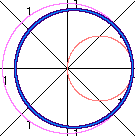
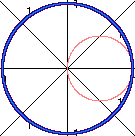
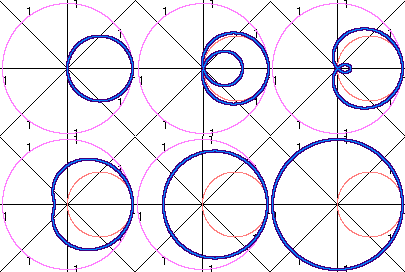
Here are some limacons of the form r = a + b cos(x). In the first figure, the red circle is r = cos(x) [so a = 0 and b = 1]. Remember that it is traced twice as the angle makes one full revolution. The purple circle is r = 1 [so a =1 and b = 0]. In the next 11 figures, the blue graphs show "a" gradually changing from 0 to 1 while "b" gradually changes from 1 to 0. [see pg 708 of Anton].


Technically, circles are not limacons - only the shapes in between are. When the inner loop first disappears (figure 7) the shape is a "cardioid" [this happens when a = b = 0.5]. You should be able to draw such graphs (with some patience, and perhaps a calculator and graph paper). See the HW on page 711. The animation below shows the 11 (blue) graphs in sequence. If it has stopped, try clicking your browser's "refresh" or "reload" button.

.