Radar remote sensing
Radar remote sensing a general term used to describe the use of backscattering amplitude Synthetic Aperture Radar (SAR) observations for studying land cover classification, soil moisture content, ocean waves, oil spill detection, and many other applications. Although I mainly use phase SAR observations in my InSAR research, some of my studies were devoted to using SAR amplitude observations, mainly for better understanding vegetation scattering, flood detection, and surface classification.
Vegetation scattering theory
In the study of Hong and Wdowinski (2014) we revised and improved Common vegetation scattering theories, which assume that the synthetic aperture radar (SAR) cross-polarization (cross-pol) signal represents volume scattering solely. We proposed that the cross-pol signal consists of both double-bounce and volume scattering components based on SAR phase measurements acquired over the South Florida Everglades found. The cross-pol double-bounce signal was explained in terms of scattering from rotated dihedrals. Based on the new scattering mechanism, we introduced a 4-component decomposition analysis, which was tested the new decomposition in both urban and rural environments. The decomposition of the San Francisco area shows higher double-bounce scattering and reduced volume scattering in the urban area with respect to the common three-component decomposition (Figure 1). The decomposition of the rural Everglades area shows that the relation between volume and cross-pol double bounce depends on the vegetation density.
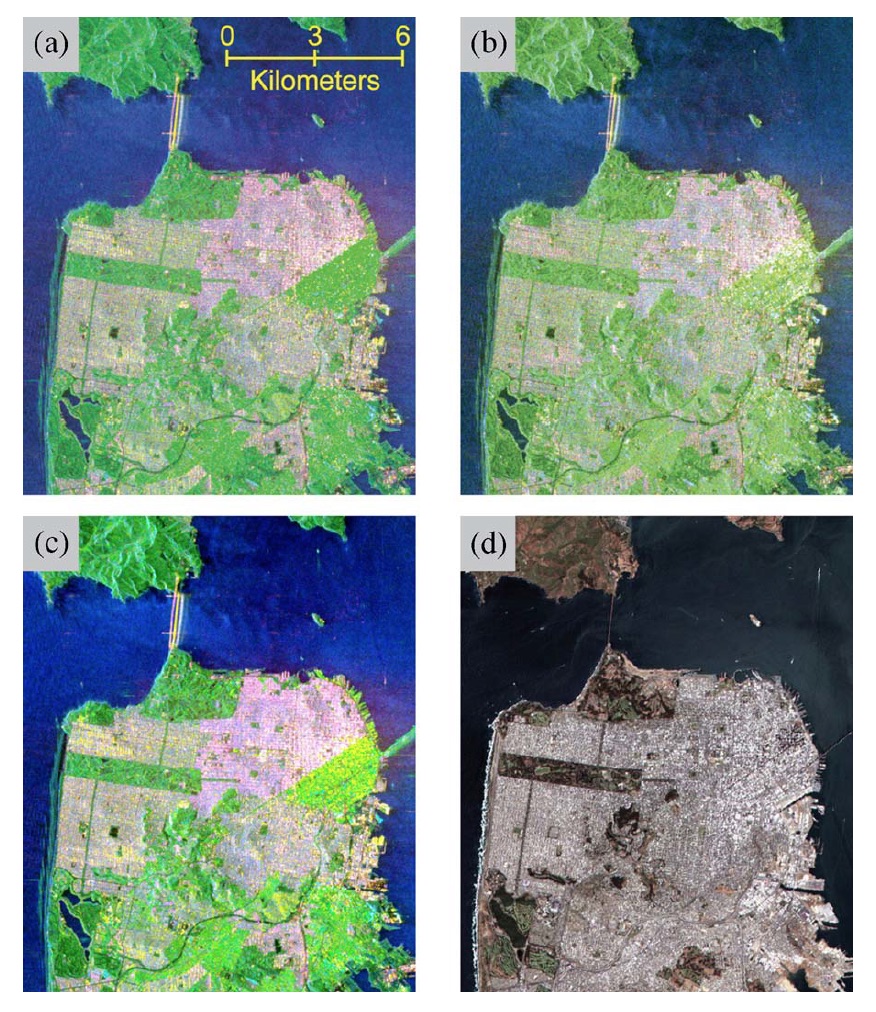
Figure 1. Decomposition results of the San Francisco area. (a) Yamaguchi’s four-component approach. (b) Yamaguchi’s four-component approached with polarimetric orientation compensation. (c) Decomposition color composite image of our approach: blue—single bounce, red—double bounce (both from co- and cross-pol), and green—volume scattering. (d) Landsat-7 ETM+ optic color composite image (http://www.landcover.org/data/landsat/). [Source: Hong and Wdowinski, 2014]
Classification studies
SAR amplitude measurements are acquired in the GHz electromagnetic spectrum and, hence, provide different measures of the surface than optical observations. Thus, when combining SAR amplitude and optical observations, we can improve the characteristics of the Earth’s surface. We used SAR amplitude data combined with optical observation for two classification types (i) vegetation and (ii) water bodies. Our vegetation classification study used quad-pol SAR data combined with high-resolution optical imagery acquired of the South Florida Everglades and produce detailed vegetation maps of the heterogeneous wetland study area (Hong and Wdowinski, 2015). Our water body classification study showed that a combined SAR amplitude and optical imagery produce improved classification compared to classifications based solely on SAR or optical imagery (Figure 2 - Xiao et al., 2014).
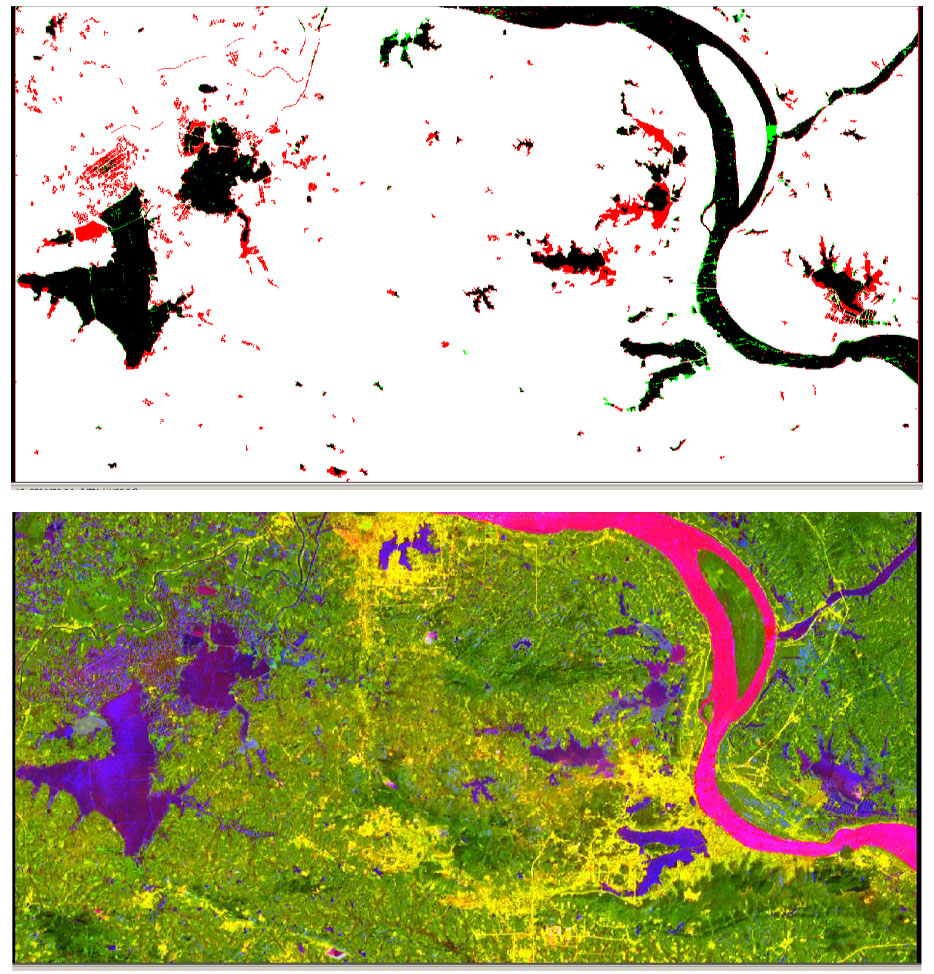
Figure 2. Water body classification using ALOS PALSAR and Landsat ETM+. (upper) Water Extraction Differences between ALOS PALSAR and Landsat ETM+. (lower) The Proposed Combination of Band 3, band7 of Landsat ETM+ with the Modified HH of ALOS. [Source: Xiao et al., 2014].
Flood detection
SAR amplitude observations are very sensitive to hydrological conditions, because scattering from wet and/or inundated surfaces produces different signals than from dry surfaces. Thus, inundation extent can be detected and mapped using change detection algorithms between dry and inundated conditions. However, flood detection can be challenging due to measurement noise and heterogeneous surface characteristics. In a couple of studies, we introduced different detection algorithms to detect flooding in two different environments. In one study, we used multi-temporal SAR data acquired before and during the passage of the 2017 Hurricane Irma over south Florida to detect changes in inundation level over the Everglades wetlands (Figure 3 – Zhang et al., 2018). In the second study, we used a different algorithm suitable for diverse urban/agricultural areas to detect flooding induced by the 2017 Hurricane Harvey over the Houston area (Jo et al., 2018). Both studies produced detailed inundation maps of the flooded area.
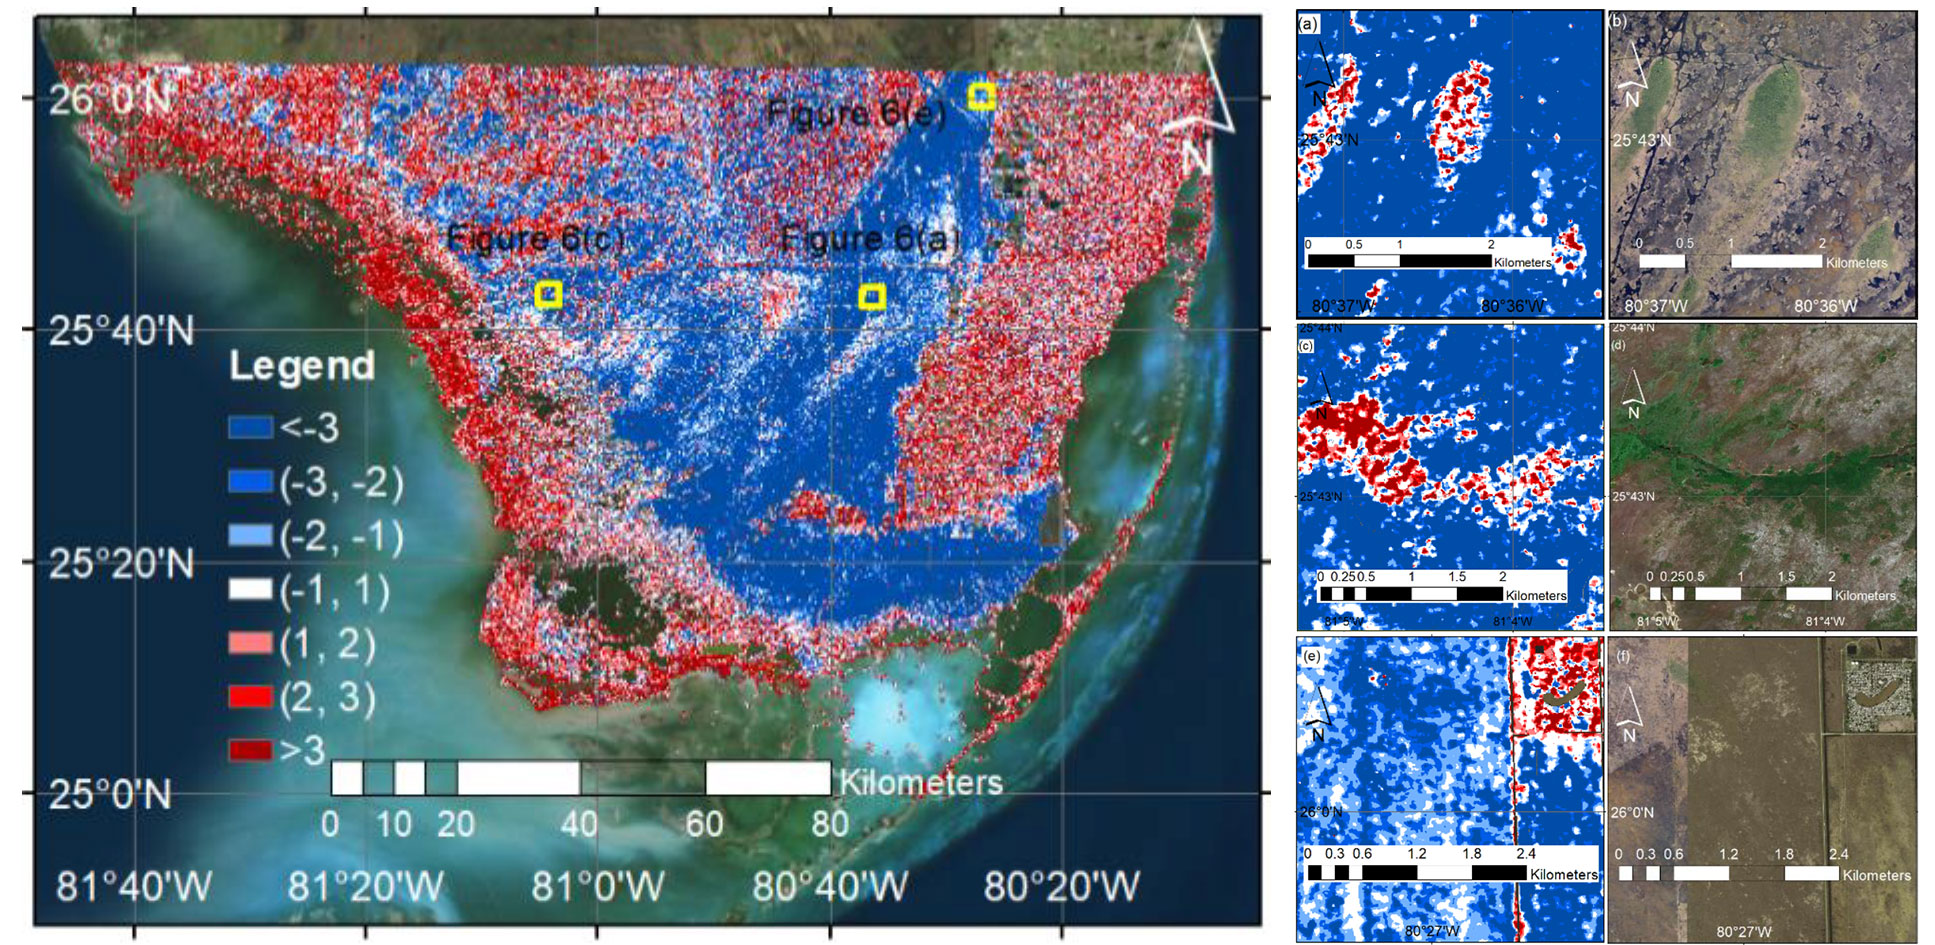
Figure 3. (right) Normalized scattering change values mapped according to the detection confidence. Blue pixels show detected scattering decrease, red pixel show detected increase, and white pixel indicates the change is not significant, i.e. non-flooded or undetectable. (left) Three example of Normalized scattering change values and their land cover characteristic obtained from satellite images in three selected locations.
Radar remote sensing publications: Hong and Wdowinski (2014); Hong et al. (2015); Xiao et al. (2014); Zhang et al. (2018); Jo et al. (2018);