Wetland Hydrology and Ecology
Wetlands are transition zones, where water flow, nutrient cycling, and the Sun’s energy meet to produce unique and productive ecosystems. They provide critical habitats for a wide variety of plant and animal species, including the larval stages of many ocean fish. Wetlands also filter nutrients and pollutants from freshwater used by humans and provide aquatic habitats for outdoor recreation, tourism, and fishing. Globally, many such regions are under severe environmental stress, mainly from urban development, pollution, and rising sea level. However, there is increasing recognition of the importance of these habitats, and mitigation and restoration activities have begun in a few regions. A key element in wetlands conservation, management, and restoration involves monitoring its hydrologic system: the entire ecosystem depends on its water supply. In the past, hydrologic monitoring of wetlands was conducted almost exclusively by stage (water level) stations, which provide good temporal resolution, but suffer from low spatial resolution, as stage stations are typically distributed several, or even tens of kilometers, from each other.
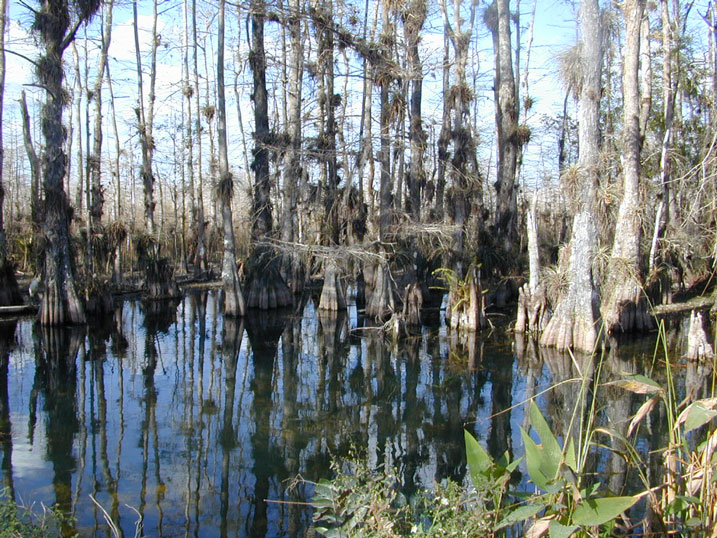
Figure 1. Picturesque wetland in Big Cypress National Preserve, south Florida.
My wetland hydrology research is based on space-borne InSAR observations that can map surface water level changes over wide-area (hundreds of square kilometers), with a spatial resolution of 5-50 meters with an accuracy of 3-5 cm. More information on the methodology and technique is available at the section InSAR. The method was successfully applied to various wetland areas in North and South America, including the south Florida Everglades, Louisiana Coast, Sian Ka’an (Mexico), wetlands in Ontario, Canada, and the degraded wetland of the Ciénaga Grande de Santa Marta, Colombia.
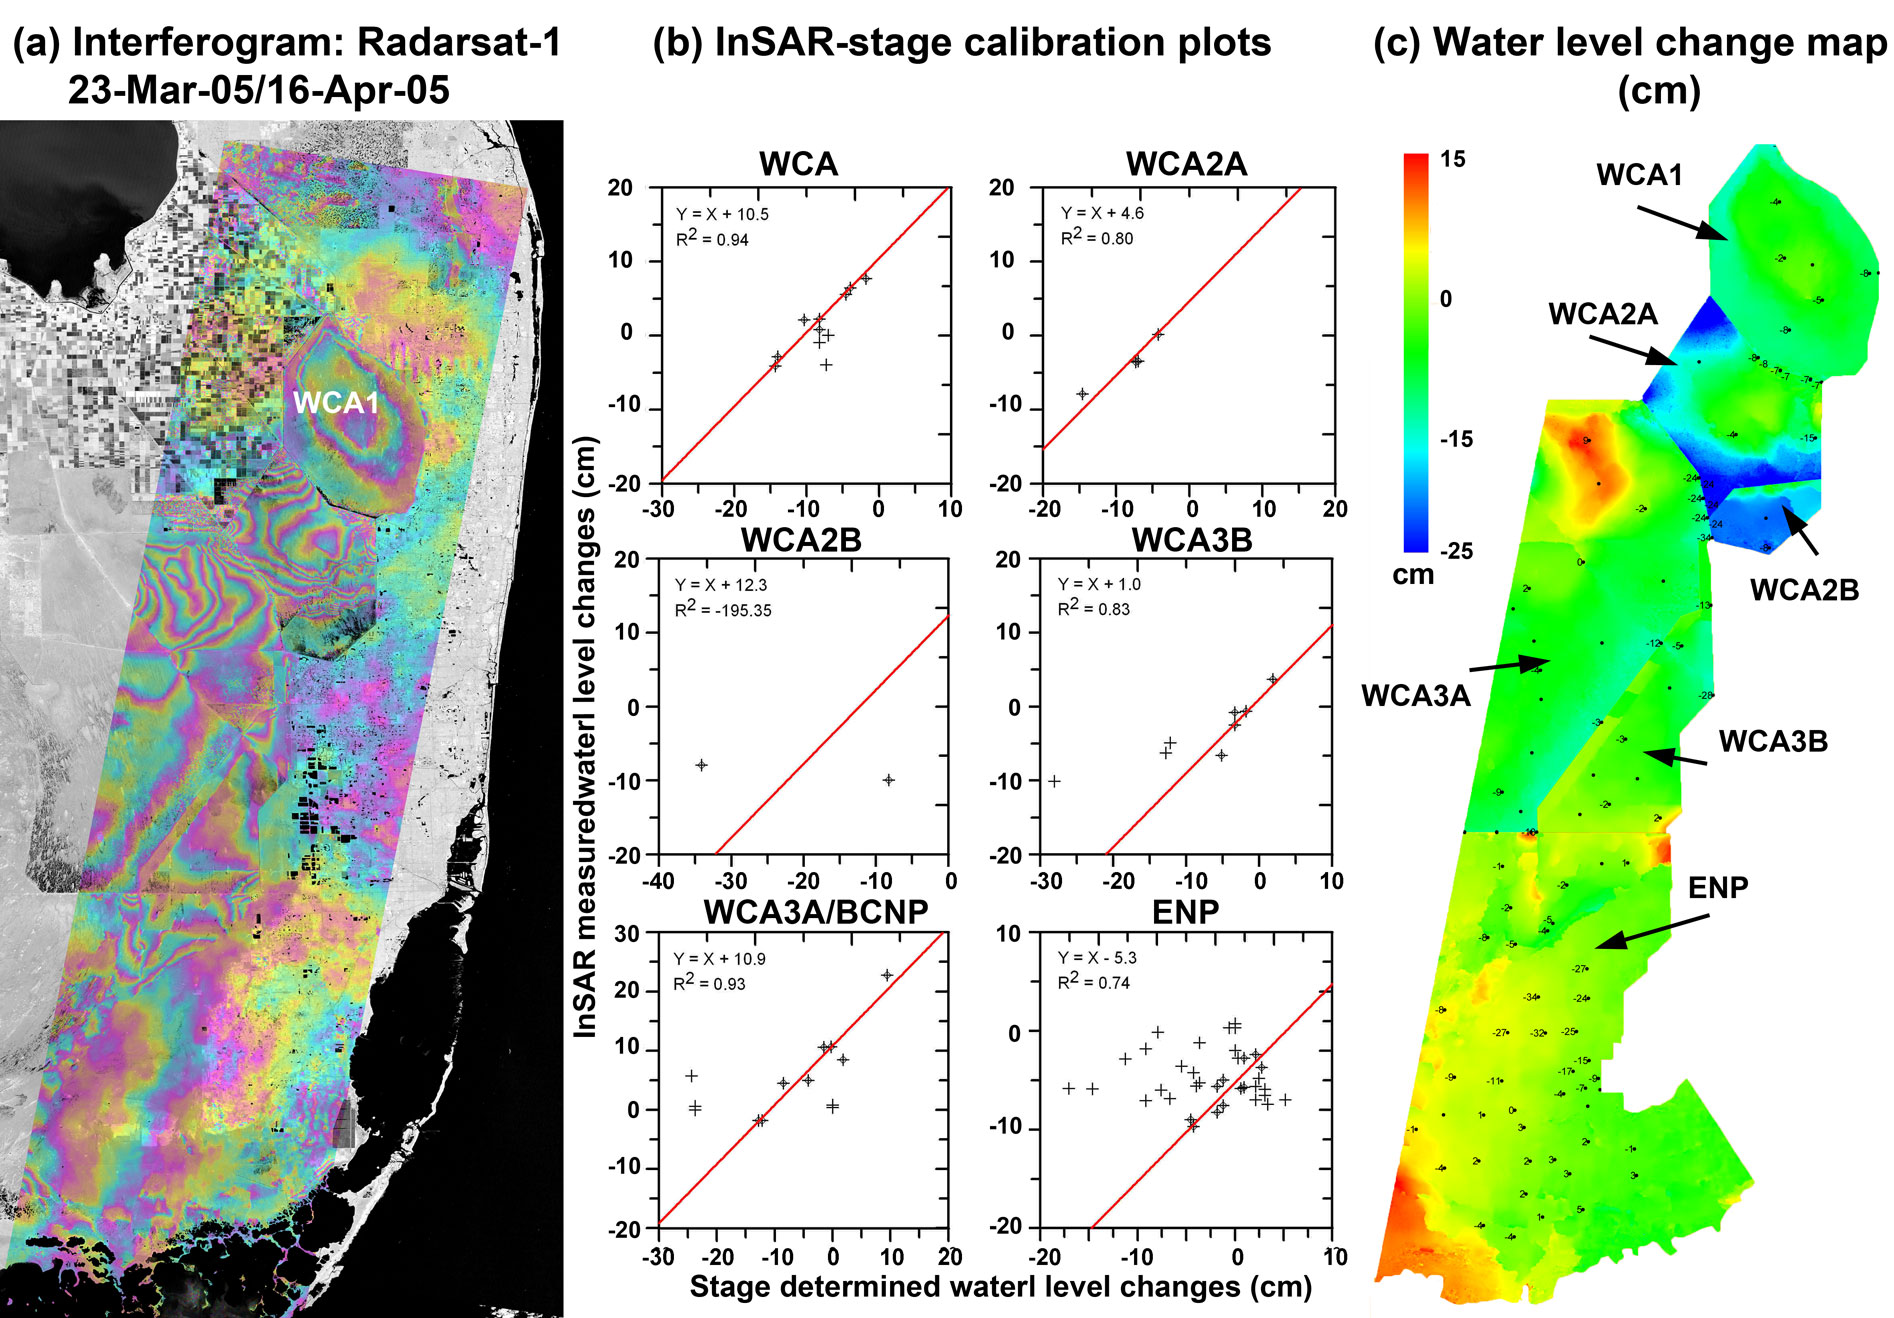
Figure 2. (a) Radarsat-1 interferogram showing phase changes in response to changes in water levels that occurred between the two acquisition dates. (b) InSAR–stage calibration plots for each water body. The water bodies and stage station locations are shown in Figure 7.5c. (c) InSAR-derived map of water level changes that occurred between March 23, 2005, and April 16, 2005. The black dots mark the location of the stage stations.
Wetland hydrology publications: Wdowinski et al. (2004); Wdowinski et al. (2008); Gonwe et al. (2010); Hong et al. (2010a); Hong et al. (2010b); Hong and Wdowinski (2011); Kim et al. (2013); Wdowinski et al. (2013); Hong and Wdowinski (2014a); Hong and Wdowinski (2014b); Brisco et al. (2015a); Brisco et al. (2015b); Oliver-Cabrera and Wdowinski (2016); Wdowinski and Hong (2017); Hong and Wdowinski (2017); Jaramillo et al. (2018); Liao et al. (2020); Zhang et al. (2022a); Zhang et al. (2022b)
My wetland ecology research has focused on the use of remote sensing techniques for characterizing wetland vegetation and monitoring vegetation changes over time. Our use of ground-based and airborne Lidar enabled us to characterize mangrove structure and aboveground biomass (AGB) at both the tree and forest levels in the Everglades (Feliciano et al., 2014; 2017). We also used SAR and InSAR observations to produce vegetation maps of the Everglades, estimate AGB of wide mangrove forests, and estimate hydrological connectivity in the degraded wetland of the Ciénaga Grande de Santa Marta, Colombia.
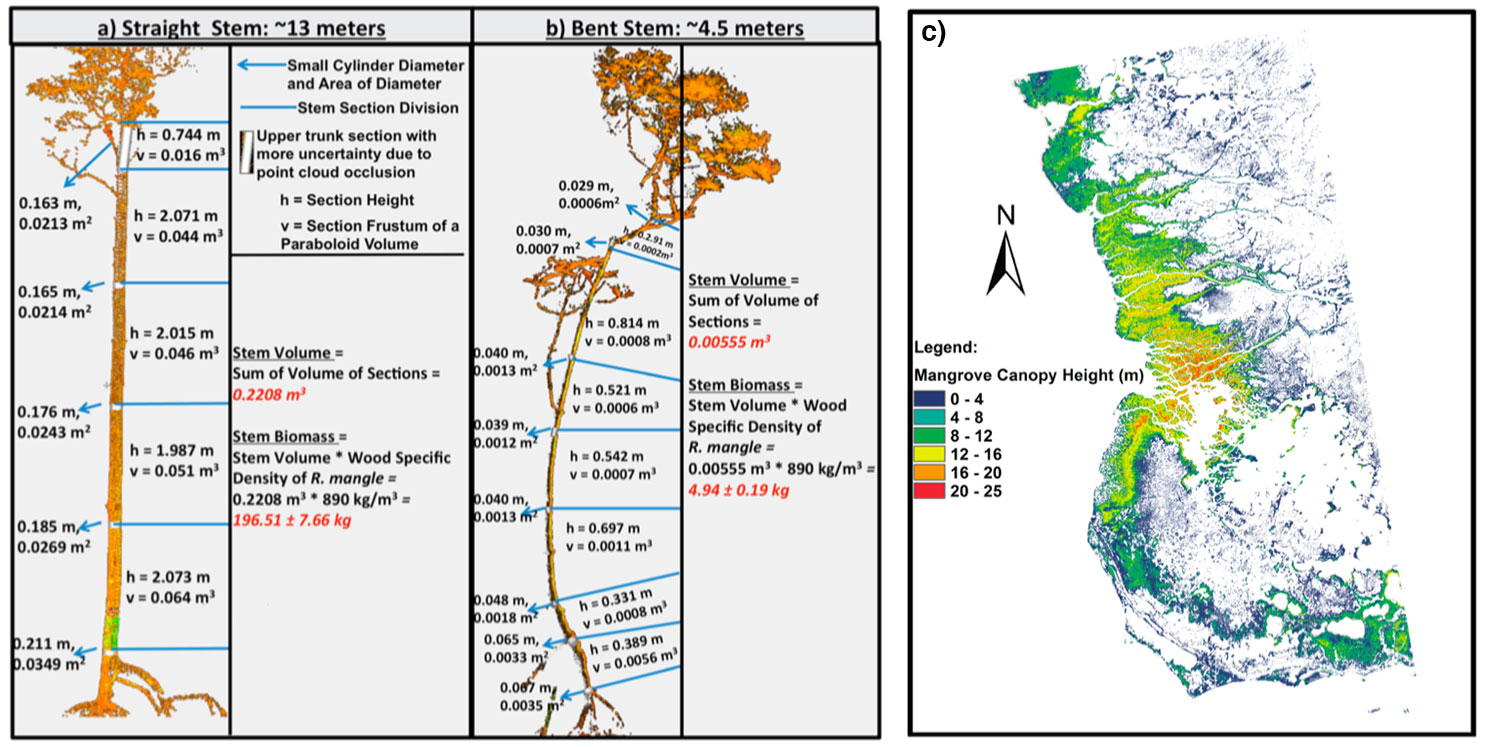
Figure 3. Wetland ecology research. (a and b) Volume estimation example for two types of stem shapes. This method is applicable for the three mangrove species. (a) Straight stem volume and AGB estimation. (b) Bent stem volume and AGB estimation. Multiple frustums are required where the stem is bent. (c) A map of canopy height of mangrove forest located in the western Everglades National Park. The canopy height was calculated from TanDEM-X scene, which was calibrated using airborne Lidar survey.
Wetland ecology publications: Feliciano et al. (2014) Feliciano et al. (2017) Hong et al. (2015) Jaramillo et al. (2018a); and Jaramillo et al. (2018b).