InSAR research
InSAR and ‘InSAR time series’ are very reliable techniques for monitoring changes mostly in terrestrial environments, but also in some and aquatic surfaces of the Earth. Both techniques have been widely used in studies of earthquake-induced crustal deformation, magmatic activity (volcanoes), land subsidence due to water extraction, glacier movements, and more (Wdowinski and Eriksson, 2009). Although most of my InSAR research was devoted to the use of the two techniques to a variety of Earth science applications, some research was devoted to technical aspects of technique development and quantitative evaluations of these techniques.
InSAR wetland – This is a unique application of the InSAR technology that works over aquatic surfaces due to the “double-bounce” effect, in which the radar pulse is backscattered twice, first from the water surface and then from the vegetation, or vice versa, first from the vegetation and then from the water surface. The technique provides high spatial resolution observations of surface water level changes in aquatic environments with emergent vegetation, such as wetlands and floodplains. Basic principles of wetland InSAR research are described in the Hydrogeodesy section. More details can be found in a review chapter – “Wetland InSAR: A Review of the Technique and Applications” (Wdowinski and Hong, 2017) and the listed publication below.
Wetland hydrology publications: Wdowinski et al. (2004); Wdowinski et al. (2008); Gonwe et al. (2010); Hong et al. (2010a); Hong et al. (2010b); Hong and Wdowinski (2011); Kim et al. (2013); Wdowinski et al. (2013); Hong and Wdowinski (2014a); Hong and Wdowinski (2014b); Brisco et al. (2015a); Brisco et al. (2015b); Oliver-Cabrera and Wdowinski (2016); Wdowinski and Hong (2017); Hong and Wdowinski (2017); Jaramillo et al. (2018); Liao et al. (2020)
InSAR time series – Time series analysis of InSAR data has emerged as an essential tool for monitoring and measuring the displacement of the Earth’s surface. One of the major challenges in time series analysis is spatio-temporal ‘‘unwrapping” of phase observations to obtain physically meaningful results. Several different algorithms have been developed for time series analysis of InSAR data to solve this ambiguity. In a review article, we compared the leading time series algorithms using an example set of results for measuring subsidence rates in Mexico City (Osmanoğlu et al., 2016).
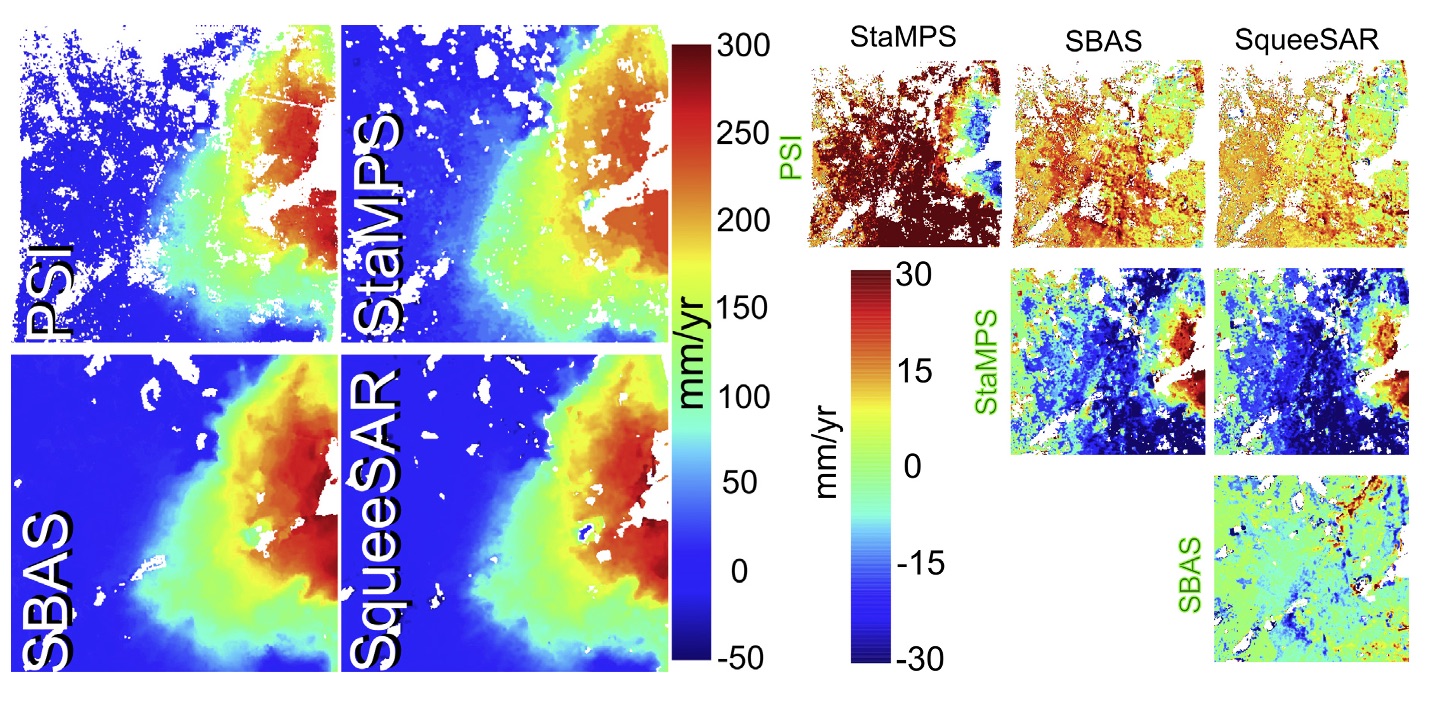
Figure 1. (Left) Comparison between results obtained from PSI, StaMPS, SBAS and SqueeSAR algorithms cropped to the study area. In Mexico City. (Right) Maps with residual velocities representing the different results obtained by the four methods. [Source: Osmanoglu et al, 2016].
InSAR accuracy is affected by various error sources, including orbital errors, topographic residuals, phase unwrapping errors, phase decorrelation, and tropospheric phase delay. Improvement of processing methods and increasing acquisition frequency has reduced the effects of most error sources. Nevertheless, tropospheric delay remains a significant error source in the InSAR time series, which propagates through the time series inversion into analysis products, e.g., velocity field. We investigated and quantified the effect of tropospheric phase delay on time series products using the two main components of tropospheric phase delay: vertical stratification and turbulence mixing (Havazli and Wdowinski, 2021). We validate our method by comparing our results with ERS and Envisat results over Socorro Magma Body, New Mexico. Our case study results indicate that Sentinel-1 can achieve 1mm/yr detection level with regularly sampled data sets (every 12 days) that have temporal coverage longer than 5 years.
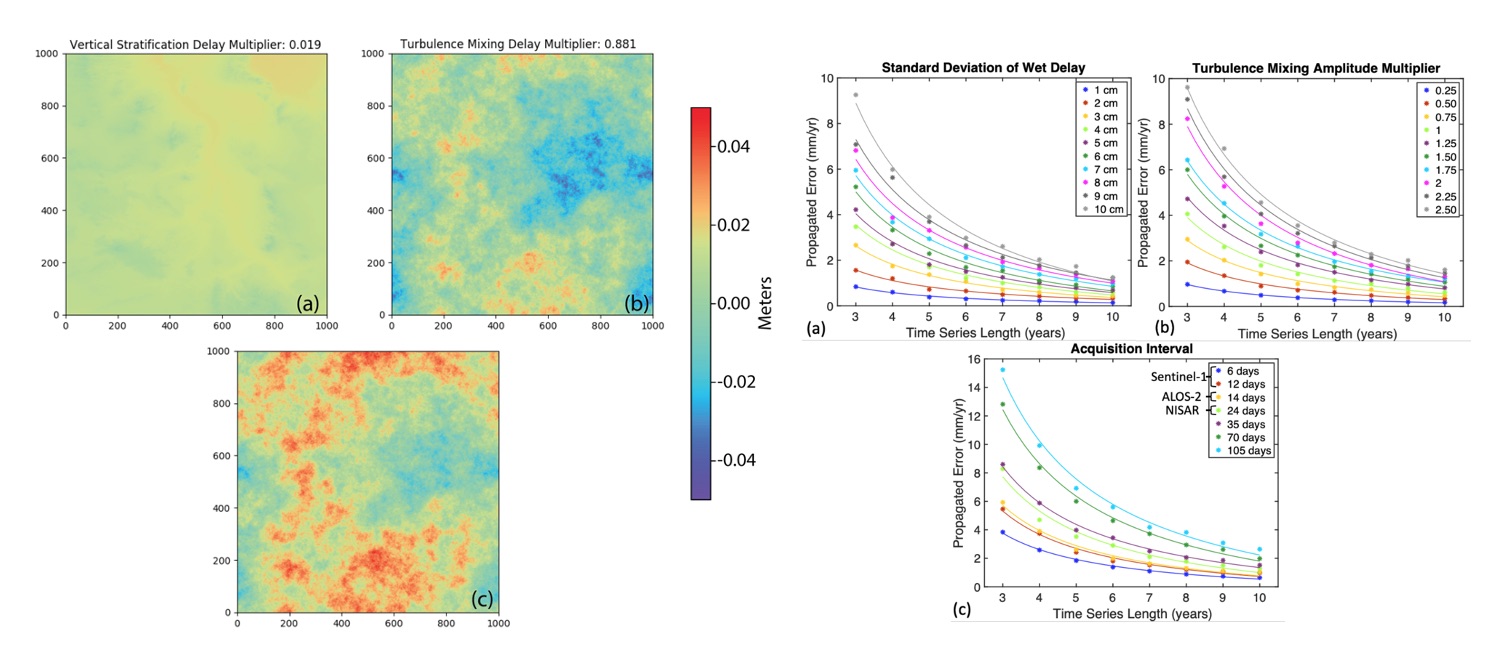
Figure 2. Simulated maps of tropospheric delay. (a) Vertical stratification delay. (b) Turbulence mixing delay. (c) Resulting delay from combination of vertical stratification and turbulence mixing delays. (Right) Sensitivity of estimated detection thresholds with respect to assumed parameters. (a) is the variation of standard deviation of wet delay calculated. (b) Scaling parameter for turbulence mixing delay. (c) Variation of detection thresholds with acquisition intervals of 6, 12, 24, 35, 70 and 105 days. Best-fitting 1/T trends are plotted using the same color scale. [Source: Havazli and Wdowinski, 2021]
InSAR time series publications: Osmanoglu et al. (2016); Havazli and Wdowinski (2021);
Wetland InSAR time series – Wetland water level changes occur at significantly faster rates (1-40 cm/day) compared with the relatively slow rate of solid Earth surfaces (order of 1-40 cm/yr). Thus, regular InSAR time series methods that were developed for monitoring solid Earth surfaces, don’t work over wetlands. Therefore, we developed unique method – Short Temporal Baseline Subset Analysis (STBAS) – that worked well for monitoring the fast changes wetland water level surface (Hong et al., 2010). We also expanded the method for processing data from multiple track to obtain a higher frequency time series of water level changes (Figure 1 – Hong and Wdowinski, 2014).
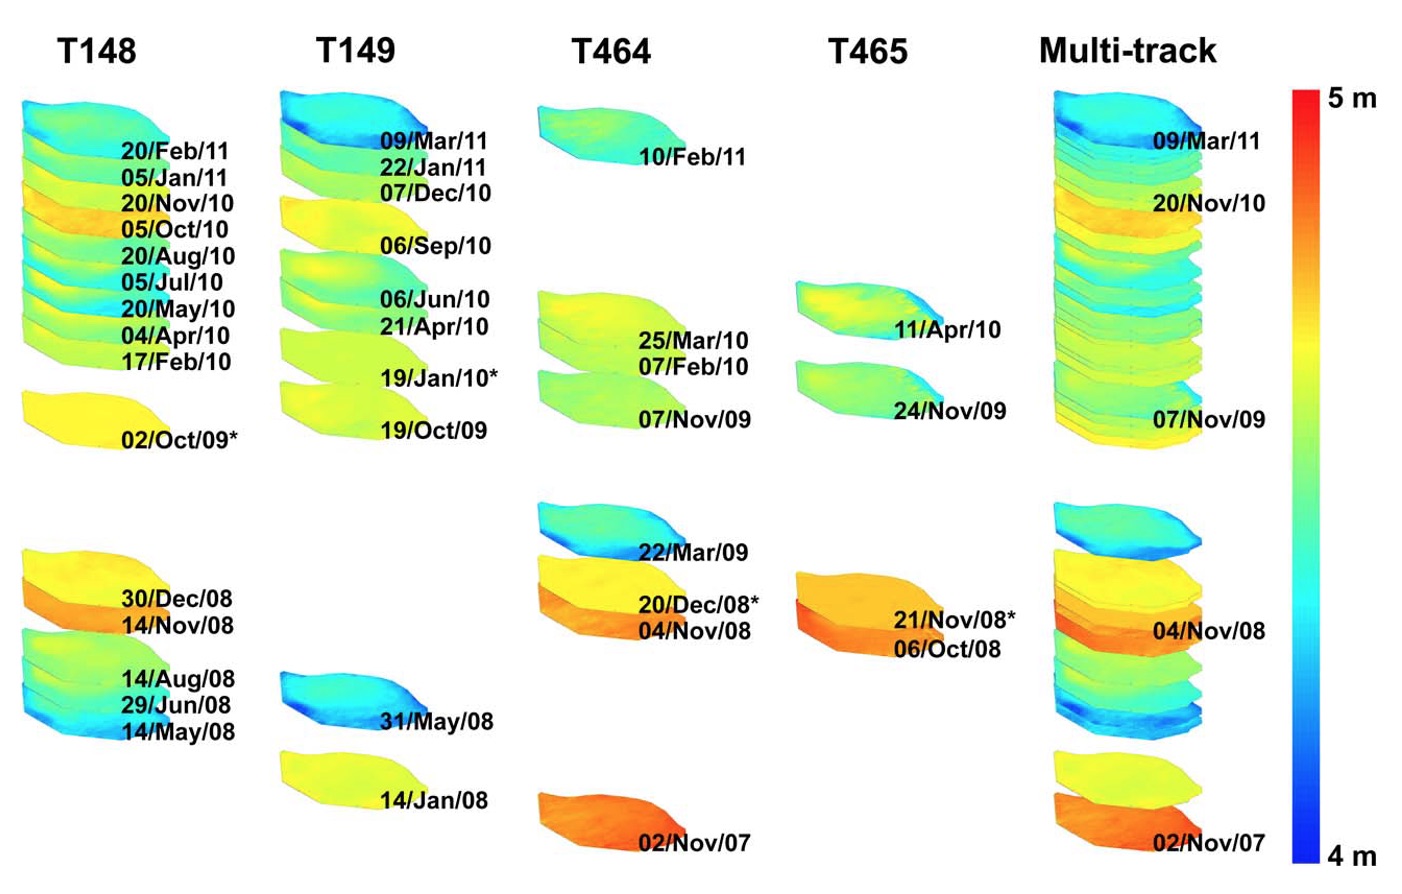
Figure 3. Wetland InSAR time series. Single- and multitrack time series maps of water levels in WCA-1, located in the northern Everglades. WCA-1 is 37 km long and 24 km wide. The time span between maps in the single-track solutions is 46 days and its multiples. The time span between maps in the multitrack solution varies between 7 and 194 days, depending on the data availability. [Source: Hong and Wdowinski, 2014]
Wetland InSAR time series publications: Hong et al. (2010); Hong and Wdowinski (2014);
InSAR-derived topography – InSAR is an important tool for measuring the Earth’s topography, as interferometric phase (fringes) calculated between two SAR acquisitions is sensitive to the distance in space between the two acquisition locations (perpendicular baseline) and the topography. In most InSAR deformation studies, topography-induced phase is removed using Digital Elevation Models (DEMs), which some generated from InSAR data, as the Shuttle Topography Rada Mission (STRM) or TanDEM-X satellite constellation mission. In couple of studies, we developed and used new techniques for measuring topography using InSAR data. In the first study, we used a 3-D unwrapping approach and extended Kalman filter to remove phase ambiguity and overcome measurement noise induced by phase decorrelation (Osmanoğlu et al., 2014). In the second study, we used TanDEM-X pursuit monostatic observations with a Large perpendicular baseline to extract glacial topography (Hong et al., 2018). Both studies showed that the developed methods can produce more accurate topography measurement than the standard ones.
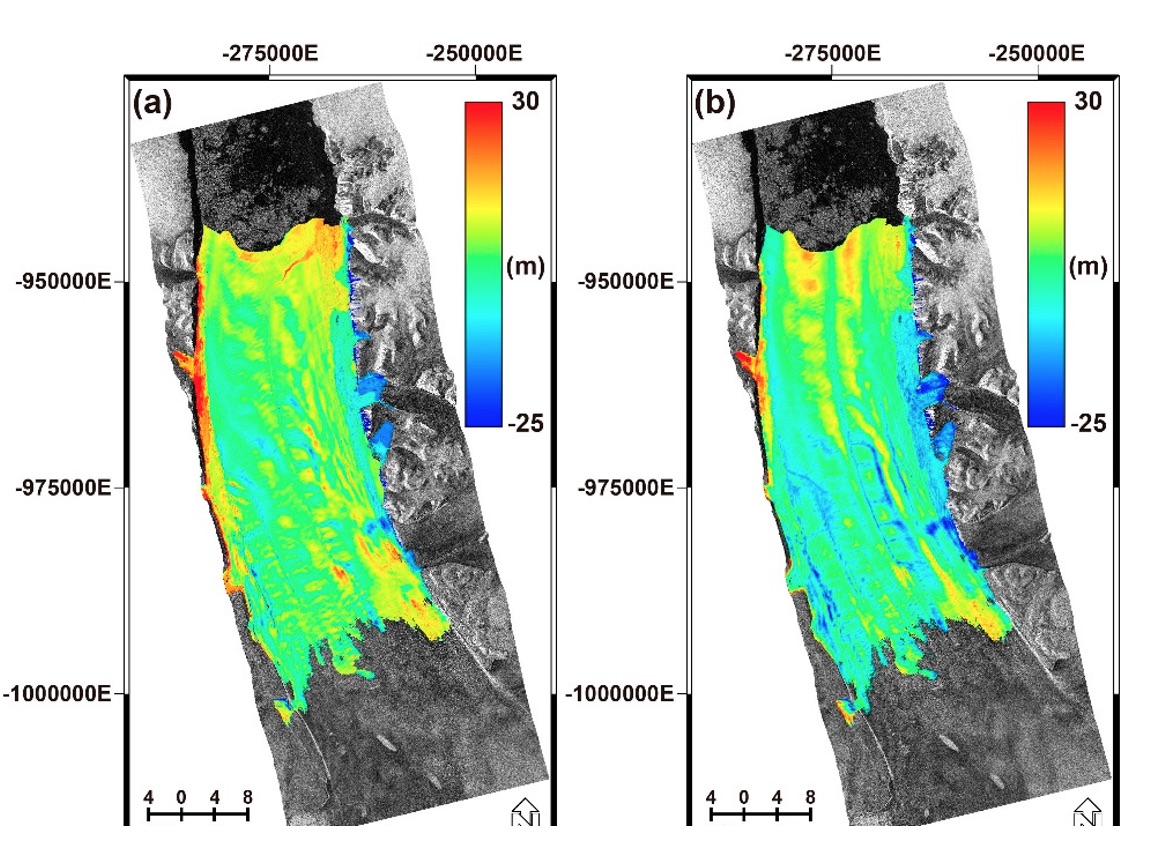
Figure 4. Topography difference maps of Petermann Glacier in Northwest Greenland. (a) the global TanDEM-X DEM and (b) Greenland Ice Mapping Project (GIMP) DEM. These maps show that the constructed DEM provides much more detailed topographic surface information compared to that of the other DEMs.
InSAR topography publications: Osmanoglu et al. (2014); Hong and Wdowinski (2018);